We analyzed 9 million paid clicks to branded content to pick out the highest quality distribution channels during Q1, 2018.
Knowing this, marketers can shape their distribution strategies and pinpoint where they should focus spend, in order to increase the attention from their audiences, i.e. get more bang for your buck.
If you’re interested in attaining the slides for this piece of research, you can find them here.
At Nudge, attention minutes = quality
To fully grasp the results from this study, marketers need to know about Attention minutes.
Attention minutes show (to the second), the active time that a human is consuming your content.
If this is new to you and you’d like to get into more granular detail on this, check out our terminology page and the article I wrote for Sharethrough last year, on ‘Why Marketers Should Pay Attention to Attention’.
Here’s what we found
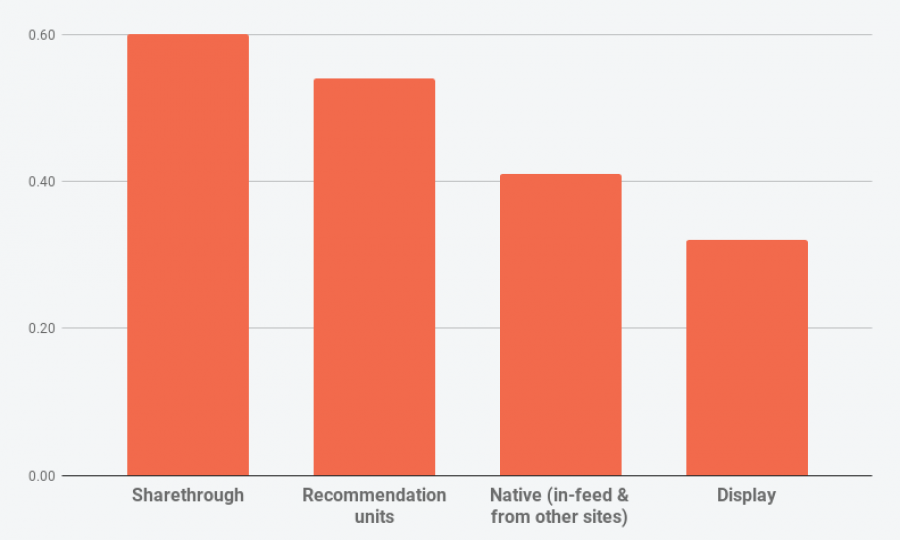
Traffic Sources vs Attention Benchmark [Q1 2018]

Compared to last year’s traffic quality study:
- Overall quality has dropped YoY.
- While social is low, it has improved drastically from last year.
- Programmatic, Display and Native remain low on quality, but have all made progress YoY.
- Email, search and influencers remain high but have dropped in quality.
- Email, search and influencers remain underutilized, i.e. still low on scale from last year.

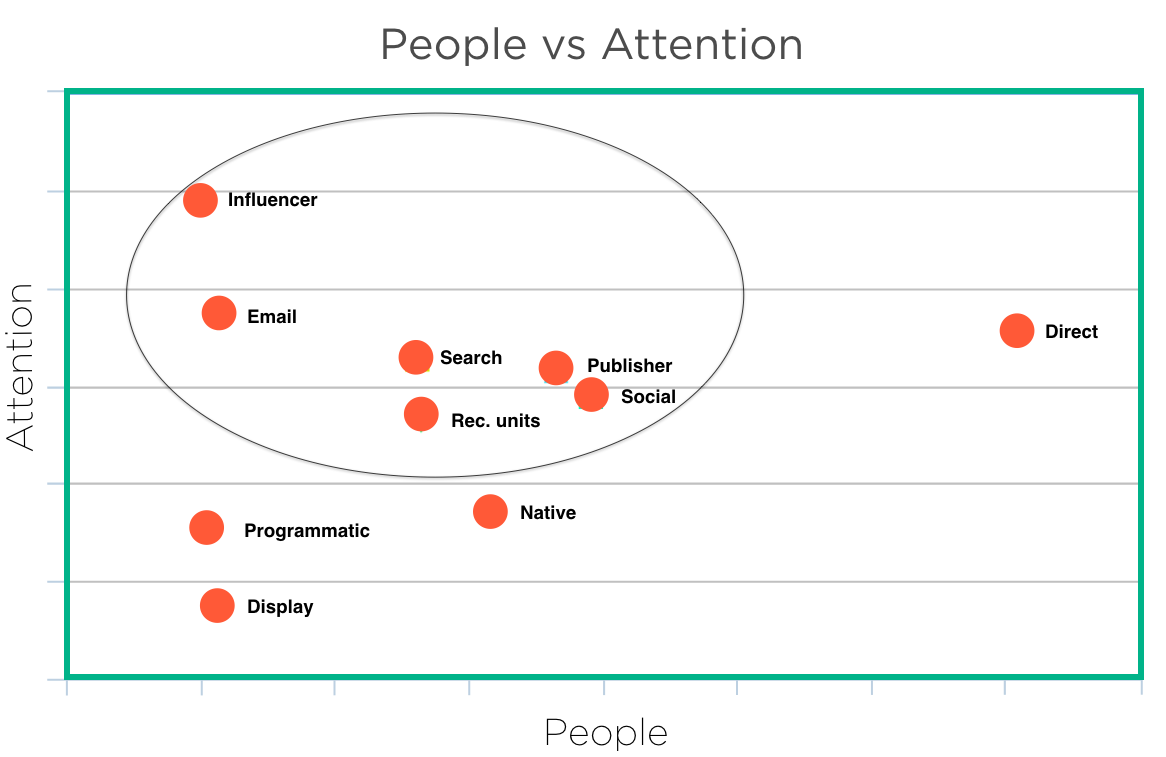
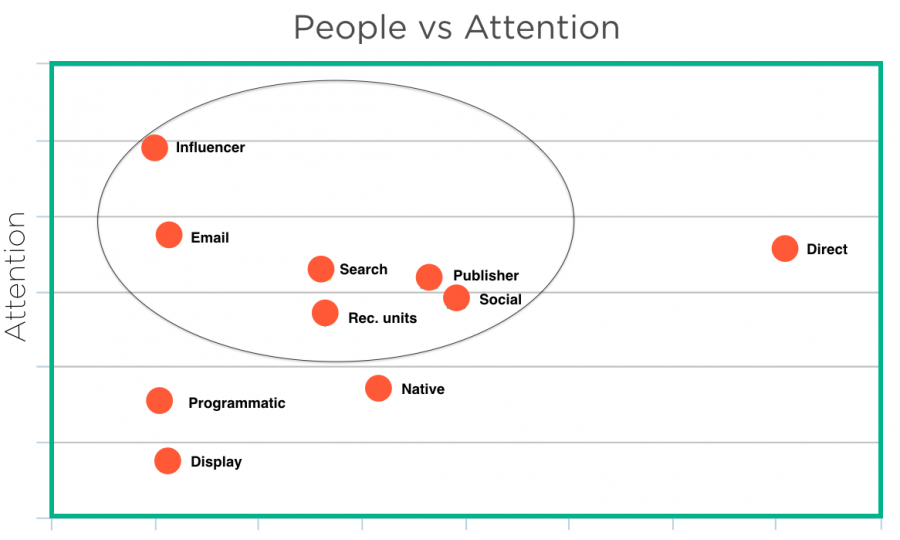
The most important thing is to find the right balance between People (reach) + Attention, as you want to ensure you reach as many people as possible, with the highest possible attention. The risk of focusing on just one or the other, is that you either don’t reach enough people, or that quality drops.
We suggest you GROW investments in…
- Influencers
- Search
- Publishers
and DECREASE investment for…
- Programmatic
- Display
Methodology
For this study, we looked at
- Traffic over the first three months of 2018
- 9.3 million, human based engagements (no bots, we filter those out automatically)
- Content types: All formats
- All industries, but our top 5 are: technology, finance, food/drink, travel & tourism health & fitness
- Average attention minutes / Norm: 0.7 attention minutes
- Note: For this study, there were fewer bulk impressions (than during last year’s study) for influencers, so we lowered the threshold (for that category) in order to extrapolate value from influencers too.
We categorized 9 million paid clicks to branded content, by traffic sources to establish a benchmark
In order to extrapolate the highest/lowest quality traffic sources, we had to pool our clients’ distribution data into categories.
We then developed an average (i.e. benchmark) against Attention Minutes across the categories, which helped us identify the best/worst traffic sources, by quality, during Q1 2018.
The categories covered in this study include:
Direct, Display, Email Newsletters. Native (in-feed & from other sites), Social Media, Programmatic, Publishers (their own content), Recommendation units (e.g. Taboola, Outbrain, etc), Search (e.g. Google, Bing, Yahoo, etc.) and Influencers.
Interesting stuff, right?
We think so too. If you’d like to learn more about this research, or get a demo of Nudge, give us a shout!
|
|---|