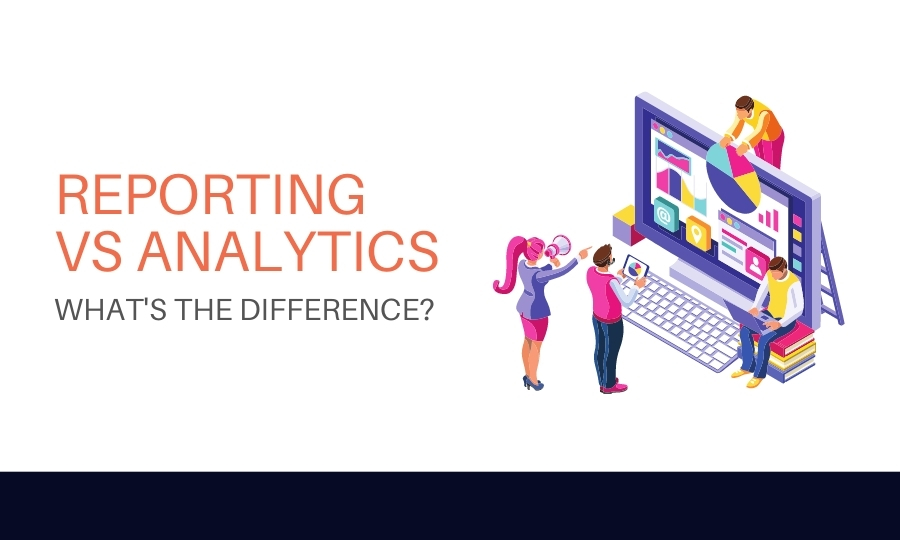
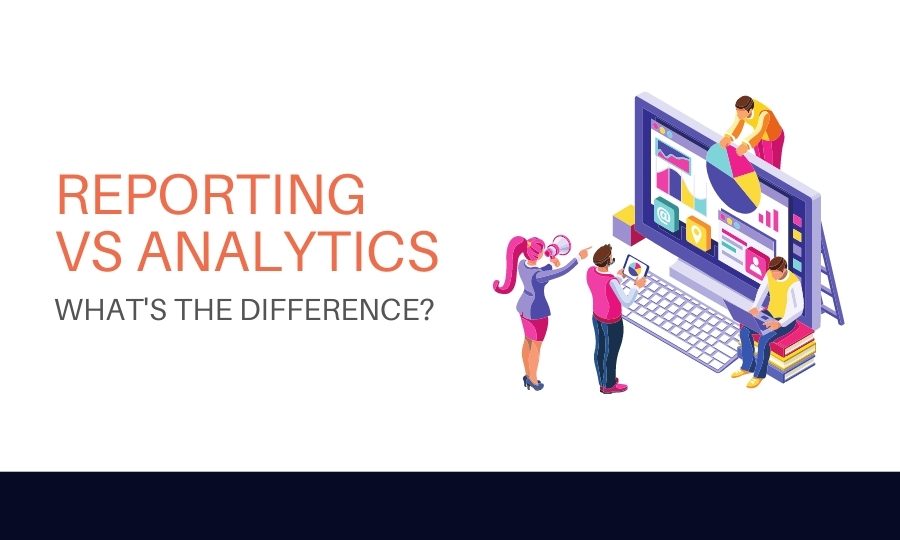
Home Breadcrumb Blog

Blog

Bridging commentary on the art & science of content; content marketing, branded content, native advertising and the analytics, attribution and intelligence that powers it.

How to interpret data

A helpful tip in interpreting data is to re-enact how the data was created. This helps understand what the data means, what it reflects and also how you can use it for decision making. For example, for content analytics, revisiting a piece of content. And following the actions that are being recorded. The closer you can mimic the real world method the better. This is a great first step in helping interpret the data that you are… Continue reading

Ben Young
Ben Young
January 17, 2020

How to measure Influencer Marketing ROI

To understand return on investment of an initiative, whether it is influencer marketing or any other, you need to anchor it against what you were trying to achieve. Then you can compare, what you got against that. Often media agencies and brands are seeking cut through, that is reaching the unique audiences and contexts that influencers have created.   Option 1: Contrast return against the alternatives To establish ROI, they want to compare against, what is the next best use… Continue reading

Ben Young
Ben Young
January 17, 2020

How to make data driven decisions

Data-enabled decisions mean you use data to help guide decision making. Data can help provide direction or help unstick indecision, by providing feedback. It’s worth noting that data just reflects something that has been observed. So it is often not perfect. But if it can help guide and inform your decision great. Continue reading

Ben Young
Ben Young
January 17, 2020

How to deliver data driven marketing

Embrace data driven decision making as an input in to your marketing. As you shape up your strategy and plans, use data audits to understand what is working and what isn’t working. Then embrace continual optimization and changes through a regular data feedback loop in to progress. This could be real-time dashboards for the tactical through to bigger reports for the monthly, quarterly and annual. Continue reading

Ben Young
Ben Young
January 17, 2020

How to analyze an article example

First load up the article, pull up your content analytics, then start to look through the data. Does the article perform above benchmarks? Below? Are people reading all of it? Is there a common drop off point? What devices are they reading on? Was it at expectations / above?… Continue reading

Ben Young
Ben Young
January 17, 2020

How to analyze data

Interrogate the data, how was this data created? Is it clean? Does the recording of the data reflect the intention for how you want to use the data. Does it reflect the right date ranges? See if you can find some comparable data, or benchmarks from older data. To help contextualize your data. Continue reading

Ben Young
Ben Young
January 17, 2020

How to analyze a chart

The first watch out in understanding a chart is looking at the scales. These can be easily distorted to misrepresent findings. Take a chart that is a portrait and make it landscape and it instantly stretches out. So do compare the scales, and the metrics used on each axis. Then explore the data itself, how was it collected, how many data points are in here. Can you draw or add any trendiness? Is the data substantial enough… Continue reading

Ben Young
Ben Young
January 17, 2020

How to analyze a video

Data really really helps in analyzing a video. So first stop is to go and get all your data on the video. Then re-watch the video, comparing how you watch it versus the data you have on its performance. Stop where people often stop, click where people are clicking. This will help contextualize and understand what the data is telling you. It may be obvious why people drop off at a certain point. Then you can go… Continue reading

Ben Young
Ben Young
January 17, 2020

How to analyze an ad

Load up all the data you have on an ad. How many people saw it, what was the click-through rate, what was the view ability or attention on it? Then compare that against your average or your benchmark. Is that good, is that bad? Did the ad drive conversions? More than you expected or less? Answering these questions will help understand whether it is working or not. Continue reading

Ben Young
Ben Young
January 17, 2020

How to do a data analysis report

The scope of this could vary dramatically but the basics of a data analysis report include An executive summary, what is that the data is showing us and what did we find. Methodology, how was the data collected Constraints/limitations of the analysis/data, establishing boundaries around the data, how it can be used, what are the strengths and limitations of it. Benchmarks, benchmarks are helpful for contextualizing performance and nuance. Continue reading

Ben Young
Ben Young
January 17, 2020