Something we pride ourselves on here at Nudge is our ability to analyze all of our rich data to spot the latest trends.
More specifically post-click, behavioral data.
This time, we set out to analyze how consumers consumption of content changes on Thanksgiving and Black Friday. We were able to do this by comparing the past week’s results against Nudge’s 2016 and 2017 benchmarks, i.e. macro trends vs specific holiday trends.
In this article you’ll find key outtakes from this analysis.
Continue reading to learn which distribution source to opt for in order to drive the highest quality traffic during these days, the best time of day to reach your audience, as well as KPIs for attention.
Content consumption
Consumers are more fickle during both Thanksgiving and Black Friday. You can still reach them, but it’s important to realize that it’s getting harder and harder.
Content consumption during Black Friday:
- In 2016, the average attention minutes, i.e. content consumption, were 15.51% lower than the yearly benchmark.
- During Black Friday in 2017, consumption fell even further to 29.68% below the benchmark – quite the drop from the previous year. The fight for attention is on!
- Mobile was holding the most attention during Black Friday 2017, with an attention share of 37.69%.
Content consumption during Thanksgiving:
- In 2016, the attention minutes during Thanksgiving were 15.53% lower attention than the Nudge benchmark.
- During 2017, it dropped to 28.03%.
- Mobile was again the best performing device when it came to attention during Thanksgiving 2017, with an attention share of 41.47%.
Time of Day
Best time of day to drive traffic by device, during Black Friday:
- On Black Friday, peak desktop usage was 9-12am, tablet at 10am and mobile 8am-3pm.
Best time of day to drive traffic by device, during Thanksgiving:
- During Thanksgiving, peak desktop consumption was 12-1pm, Tablet 8pm-10pm, and mobile was fairly consistent from 9am through 11pm.
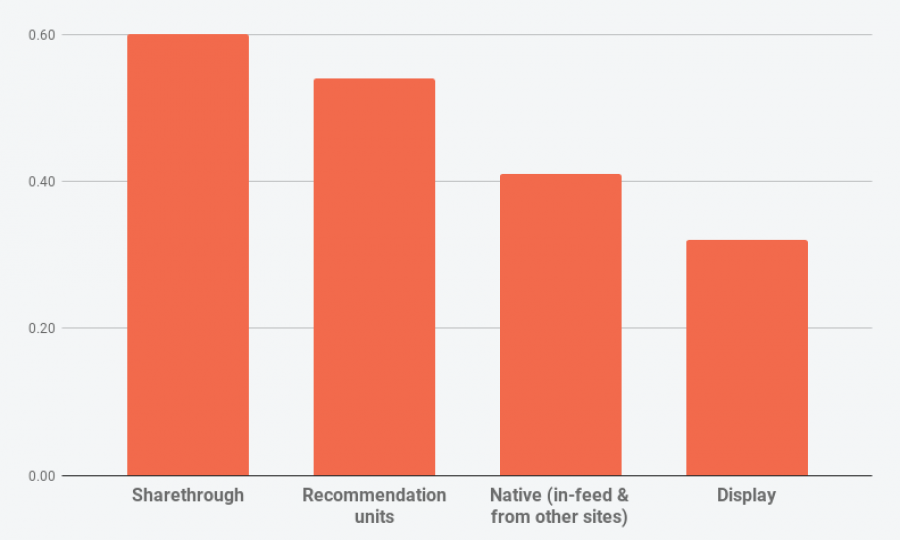
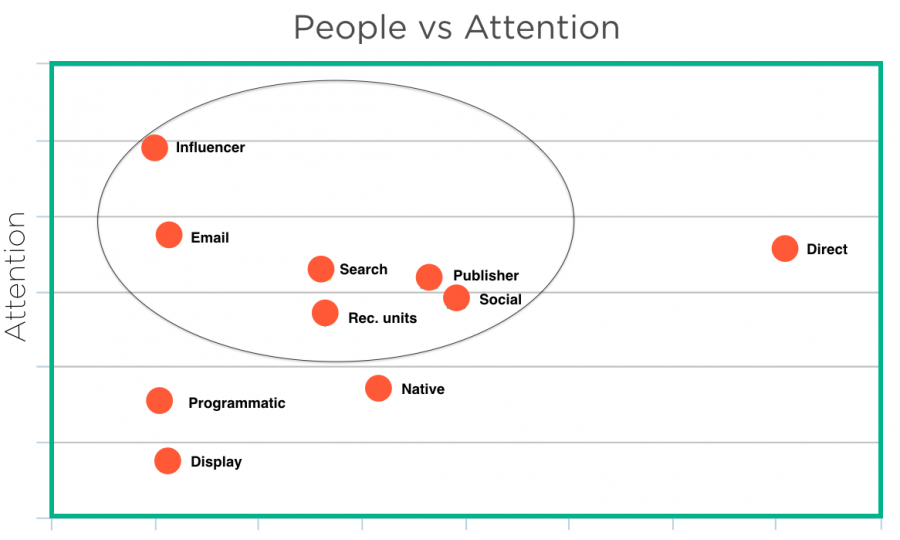
Distribution Sources
In order to get extrapolate these numbers, we categorized all of our client’s distribution data, we then compared each category’s avg. attention against the mean (the average attention across all categories).
The top three distribution sources by attention during Black Friday were:
- Email (46.50%)
- Search (7.69%)
- Native (6.63%)
The top three traffic sources by attention during Thanksgiving were:
- Email (41.04%)
- Native (9.26%)
- Social (7.81%)
We also recently analyzed 7 million paid clicks to branded content, which shone the light on the best distribution sources by attention from a macro level. More on that here.
That’s it!
Let us know if there’s anything we can help you with before the new year, whether it’s a last-minute campaign, data for a pitch, or you just want to test out our latest features, as you evaluate tools for 2018.
|
|---|