
As a marketer, it’s so easy to find yourself in a situation where looking at performance metrics just turn into a bunch of meaningless numbers. And even if your metrics tell you how you’re performing compared to previous weeks/months/years, you still don’t know what you should be able to achieve within your industry and/or vertical. Without a bigger picture you’re in danger of riding into battle with your competition, blindfolded.
Speak to a member of the team to learn more.

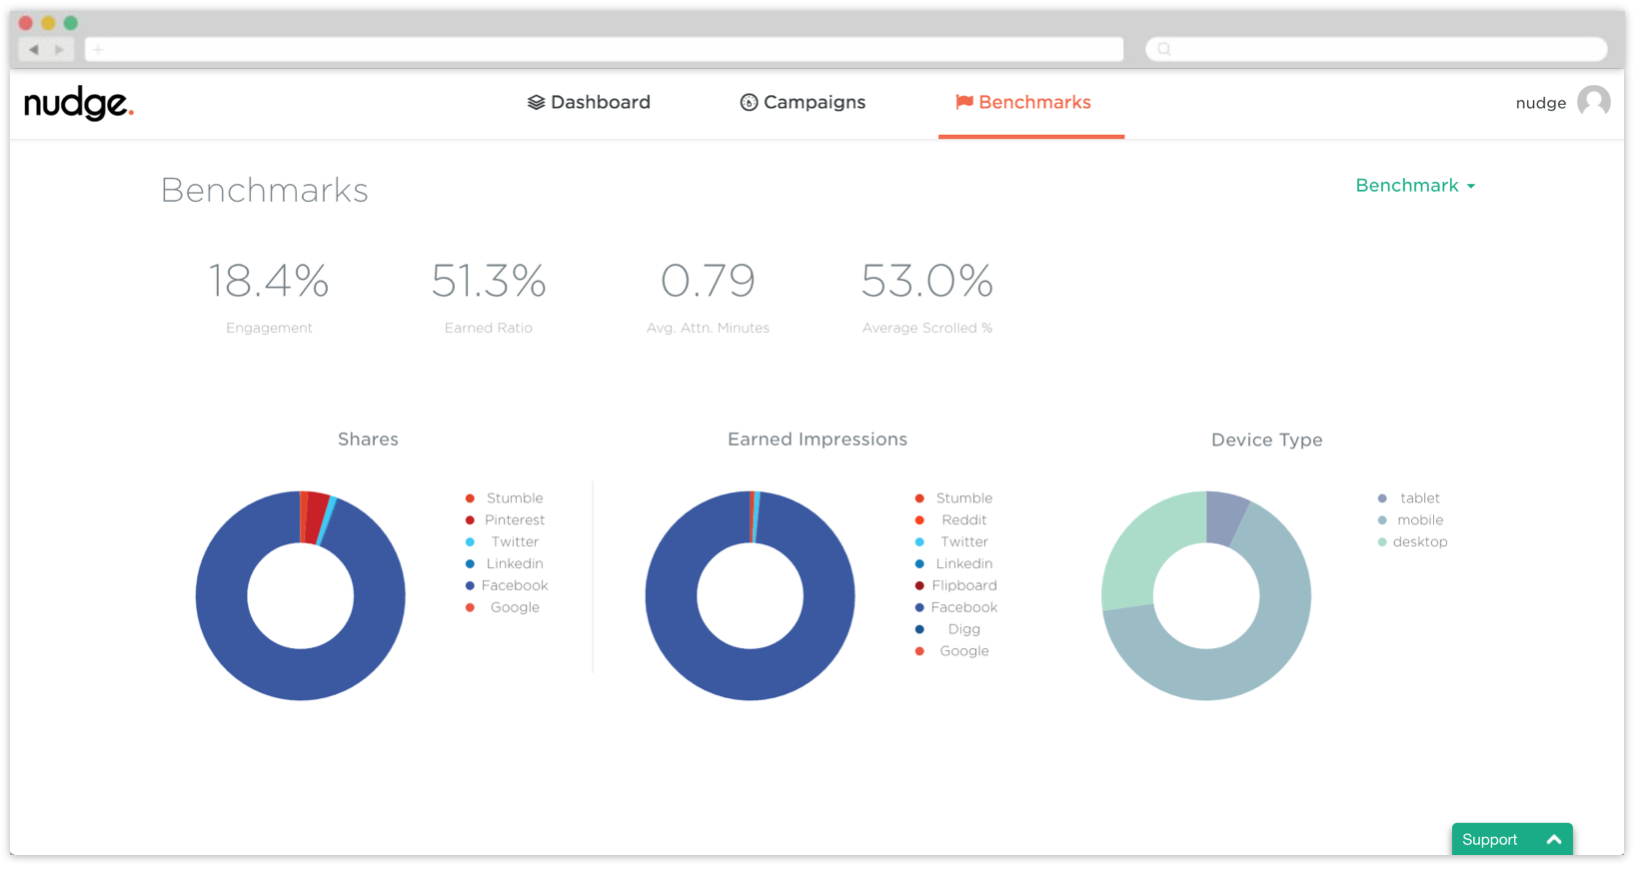
Nudge Network Benchmarks (NNB)
Native content is a new and emerging space for marketers, benchmarks help you navigate the multiple providers, publishers successfully. Further they keep you on top of the trends.
Benchmarks are the best way to understand comparative value against other campaigns until industry-specific norms are established. With Nudge you can benchmark your campaigns using normalized metrics built for purpose as native requires a blend of content, social and advertising KPIs, delivered quickly. Using Nudge Network Benchmarks is a great way to understand how successful your campaign has really been, and where/when it hasn’t.
Examples of useful metrics you can benchmark with Nudge:
- Scroll – Total impressions of your campaign.
- Engagement – Amount of people who shared it and amount of those who read it.
- Attention minutes – Time that consumers are actively consuming the content.
Nudge continuously pulls average campaign results across all native campaigns, as well as averages across each category (i.e. food & drink, technology, automotive) in order to give clients the best possible insights that never goes out of date. NNB enables marketers to cut through the noise and see how they’re performing against their competitors, as well as having the tools to understand how to best optimize for desired outcomes.
- Agencies like Spark | Mediavest, Dentsu and MullenLowe use benchmarks to not only report against at the end of the campaign (within their clients categories) but also to help set KPIs before a campaign starts.
- Publishers can use Benchmarks as a reporting tool but also a sales tool. For example a recent Nudge publisher was able to use the Nudge benchmarks to prove why a potential financial client should book with them. Using Nudge benchmarks they could show not only what the industry gets, but how their financial content gets attention 2X higher than average.
- Brands can use Benchmarks to prove that their content is performing at category level. They can also use the benchmarks to uncover what owned content on their site is performing above average. They can then use this data to optimize, promote and run as native advertising on a publisher site.
Video: Setting KPI’s in relation to Nudge Network Benchmarks
Get in touch to see how Nudge can work for you.
Top reasons for why agencies need to use benchmarks
- Contextualise performance.
- Hold partners accountable.
- Help identify areas of performance and improvements for next campaign.
- Reporting.
- Set KPI’s.
It’s a great way to get alignment between buyer/seller by looking at the benchmarks to get away from potential issues and get campaign expectations out in the open.
Top reasons for why publishers need to use benchmarks
- Arm sales team.
- Establish KPI’s.
- Reporting.
- Allowing ad-hoc team to consistently deliver high performance.
A big reason for why publishers choose NNB is the massive advantage it delivers to sales teams. To give an example – a client of ours recently met with one of the true giants within retail banking and wanted them to run content on their platform. Our client were able to convince them of doing exactly that by showing them benchmarks that gave them the necessary numbers they needed to invest. They had the undoubted proof they needed to make the sale.
Get in touch to see how Nudge can work for you.
Summary
Nudge Network Benchmarks strengthen marketing teams by handing them the tools to see market trends and how they’re doing comparatively. It also enables them to look deeper into specific vertical benchmarks to see how they stack up against competitors in order to understand how their tactics and strategies are working.
Without knowing what to expect within your market, brands will eventually find themselves lagging behind. It’s a powerful tool that can be used for optimization on a number of levels; whether it’s for a particular social media campaign or strategic budget decisions going into the new fiscal year.
We’ve found that a winning formula for clients lies within looking at benchmarks in combination with their own data to alter current/define future strategies.

|
|---|