Website analytics is the process of collecting and processing data on usage of a website. Analytics platforms gather this data and show it in an online dashboard. Often this is done in or close to real time. This is an important process to understand how people are interacting with your website.
Website analytics is the original digital analytics and paved the way for many different types of analytics over time. Yet it remains a solid staple and reliable tool for webmasters.
Before you go any further, if you are new to website analytics, these are some articles you might consider:
- How often are you checking on your web analytics?
- What are the benefits of web analytics
- What is web analytics that respects privacy?
- How does web analytics help in tracking referrals
- Which is the best web analytics for ecommerce
- How do I get free analytics for my website?
- Easy to use alternative to Google Analytics
- Best Website Analytics Tools 2023
This guide dives into website analytics to help you understand what it is, what they are used for and how they can help you.
This post contains:
- Importance of website analytics
- What metrics do people use from their website analytics?
- What do website analytics enable?
- What does an effective analytics process look like?
- Considerations when selecting a website analytics tool
- Privacy concerns and third party vs first party cookies
- What are some of the limitations of website analytics?
- Do discrepancies occur in Website Analytics?
- UTM parameters
- Ways to improve your website with analytics
- How does attribution tie into Website Analytics?
- A brief history of web analytics
- Future of web analytics
- How Nudge can help
Importance of Website Analytics
Without website analytics, companies would be operating in the dark. Their customers would be visiting the website with no feedback loop to the company as to how it was operating. They wouldn’t know if it was effective, if it was broken, what the most popular content was, how much traffic it was generating etc.
Creating a website, is a digital storefront for every company, and it is important that they understand how it is performing. Many websites these days take considerable investment to stand up a competitive offering. And analytics helps articulate its performance.
It’s hard to understand the importance of a web analytics dashboard, which brings the data to life and helps provide meaning. Rather than looking at raw numbers in an Excel sheet, the visualizations and filters, help derive meaning from the data. The dashboard is like a shortcut to faster analysis.
What metrics do people use from their website analytics?
Here’s a common array of metrics that Nudge collects, noting any comparable metrics. This is to replace Unique Visitors.
People
The numbers of users who visited a piece of content at least once.
Earned Impressions or Social referrals
Page impressions created from sharing of the content.
Impressions or Pageviews
Repeat visits to the content, or multiple URLs viewed.
Attention
How long people consume your content, measured second by second. This is to replace Time on Page.
Engagement
What percentage of people are engaging on the page for a threshold. Increments like 5, 10, 15 seconds.
Bounce Rate
What percentage of impressions left without engaging in the content. Nudge excludes people that read the back and then hit the button from the bounce rate measure. To give a more accurate bounce count.
Average Scroll
The percentage down a page a user has scrolled.
Time to Scroll
An aggregate view of how people are scrolling down the content and the time it takes to get there.
Often each of these metrics you can view by the site traffic, date range and device. Providing deeper levels of analysis.
More on:
- Guide to Scroll Depth
- Guide to Bounce Rate
- Guide to Conversion Rate
- What are engagement analytics?
- What is attention analytics?
What are Website Analytics used for?
Website analytics are used for many purposes now, they allow you to complete many straightforward business processes.
Some of the ways we see people using analytics:
- Pin the dashboard, as a tab, and visit each day to see how performance is going today.
- To identify urls that need improvement, or see how your content is performing.
- To get insights onto how customers are engaging.
- To prove the ROI of efforts.
- To predict the success of future projects, using older data.
- To build benchmarks.
- To help articulate to others how well your work is doing.
- To justify current budget, or to help acquire more budget.
- To upskill juniors on the team.
- To optimize content distribution or PPC efforts.
- To optimize social media clicks.
- To set KPIS, or keep track of KPIs.
- To see how work creates business results (conversions/leads/purchases).
- To quantify the media value of a campaign.
- For internal competitions.
- To see how documentation performs.
- To identify products which are resonating.
- See how employees are engaging with intranets.
- To measure branded content with partners.
- To see how campaigns are performing.
- To get transparency with influencers.
- To validate and test content strategies or tactics.
- To power internal scorecards.
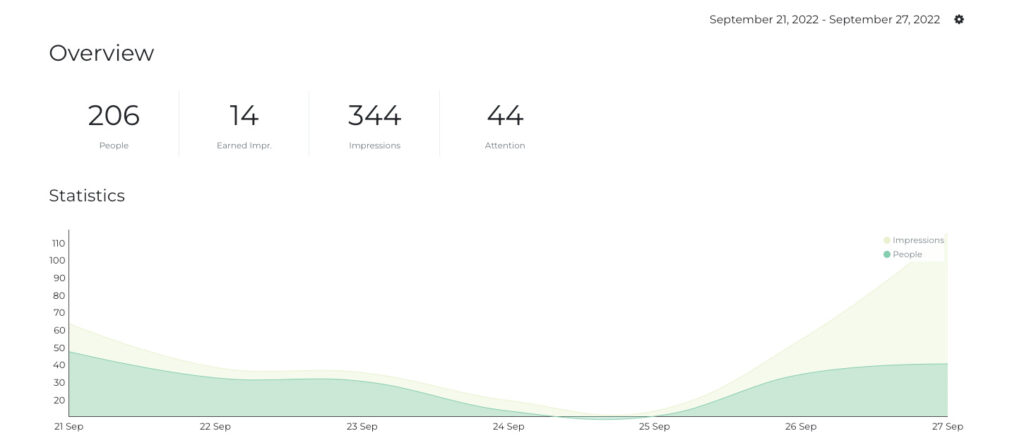
Example of a website analytics dashboard.
What does an effective Website Analytics process look like?
To get the most out of website analytics, many companies adopt a process like this.
1. Start with the business objectives
Understanding what the website is trying to achieve first and foremost.
2. Find the metrics which suit that objective
Zooming in on the most suitable metrics to measure, helps the team focus on the right things.
These metrics can become your KPIs or part of your internal scorecard for success. If you are working with partners, make them part of the process to select these.
3. Implement the measurement
Implement the measurement on the website. Complete QA, to see that it is tracking as intended.
To do this effectively, make sure you allow time for this. Rushing it, can lead to mistakes and unintended consequences.
4. Collect data
Each day, you can see how data is coming in, in your online dashboard.
Many platforms can send you custom reports. Or an analyst can prepare them for you.
5. Make adjustments
Depending on what is meaningful for your work, making adjustments each day, week, or month. It’s about striking a balance depending on how long your content is in market. For shorter campaigns you may want to adjust more regularly.
For longer term, making adjustments each month might make more sense.
6. Create reports
Creating reports helps uncover areas of opportunity and holds the team accountable. They are also vital in helping other stakeholders understand how content is driving performance.
This is an area, where the value can be overlooked. But the act of putting in a report, on a regular cadence, helps the team continuously improve. And keep performance in mind.
7. Reflect/review/inform
Once a quarter, doing a workshop to look at all the data, reports and work. Then analyzing it to find trends, wins, areas of improvement.
This helps to prove out ROI but to then also provides data, to predict how future content investments will perform.
Considerations when selecting a website analytics tool
When selecting a new analytics tool, a sound understand of what you are trying to achieve is top priority. Then you can evaluate several tools to see how they fit your needs. Most platforms offer a free version at no cost, to enable you to test them.
When selecting tools, keep in mind:
- The best tool is the one you use, if you install it but don’t use it, it isn’t driving as much value as it could be.
- Ease of use, over time, many folks of varying skillsets will need to log into the Analytics and get data. The easier to use, the more accessible it is.
- Time to insight, platforms that help you get to insight faster, are going to help you do your job more effectively.
- Continual investment, traditional analytics have not received much investment in recent years, consider a platform that is continuing to invest in a changing market.
Read more:
What are the different types of website analytics?
Over time there have emerged different types of website analytics. These can be classified as follows:
- Javascript (most popular), analytics that requires a tracking code installed on your website
- Log level analytics, these use the server software to write a log file when a user accesses your website. Webalizer is an example of this.
- Platform provided analytics, where a hosted platform provides built in analytics.
The scope of website analytics has grown, to include behavioral analytics, marketing analytics, content marketing analytics, attention analytics, inbound analytics, CRM/CDP data lakes and more.
Privacy concerns and third party vs first party cookies
Privacy can be a concern when it comes to website analytics. Most website analytics tools offer reasonable tracking in a privacy safe manner. Some of the more traditional tools like Google Analytics may use your data to help your competitors.
Customers may not want to be tracked to the degree that companies would like to. As such, compromises need to be made and expectations need to be set with customers.
Apple has found, that giving users choice and respecting their privacy is the happy medium. Which is what Apple Tracking Transparency (ATT) is all about. Many firms adopt opt-in practices for their data collection, to provide that choice to their users.
Regulators have also provided different guidelines, depending where in the world customers are visiting from. Such as GDPR and CCPA. Companies need to be attentive to these guidelines.
What are some of the limitations of website analytics?
Most website analytics require a tracking code to load on the browser. This is acceptable for more users but has its own limitations.
- Ad blocking, users may have installed scripts to blog the tracking code.
- Older devices, users on older devices may not be able to load the code effectively. Think browsers 10 years old kind of thing.
- Requires extra work to get content, analytics by itself isn’t enough, companies need to take action from it to get the most value.
Do discrepancies occur in Website Analytics?
Discrepancies arise from the differences between two systems and mistakes that are made in implementation.
The biggest cause of discrepancies between two analytics system, is the users that leave before a page has finished, and one analytics system has loaded but the other has not yet. Discrepancies of a few percentage are reasonable. If there is a large discrepancy (like 10% or more) you need to investigate.
Read more in our Guide to Analytics Discrepancies.
UTM parameters
UTM parameters are extra parameters on URLs that provide extra information about a click or website traffic. These are synonymous with website analytics.
For more on using UTM parameters, these posts may be helpful:
- How do UTM parameters work?
- Which UTM parameters are required?
- Why use UTM parameters
- How to test UTM parameters
- When should you use UTM parameters?
Ways to improve your website with analytics
Website analytics yields a lot of rich information, here are some of the common ways of improving your website with analytics.
1. Create benchmarks
Take all your data and create a benchmark of performance. This is what we expect for each webpage.
Then, go and look at the top 10% of pages, to understand why they are performing the way they are. Then do the same for the bottom 10%. And improve them.
2. Analyze traffic sources
Look at all your different traffic sources, which are driving high volume, which are driving high attention and low bounce.
It may be you can stop the low performing traffic sources and focus more budget and attention on the higher performing traffic sources.
3. Examine your content
Using Avg Scroll and Time to Scroll, go deeper on your content, to see where the most engaging parts are. Use these insights to adjust and improve your content pages.
You may find areas that are not that engaging, so you take them away, or find ways to improve them. You may need to add additional elements like more imagery or videos to maintain engagement.
4. See what is socially engaging
It is always a good sign when customers are sharing webpages on social networks. This indicates, that it is a useful resource.
Look at your content, to see what is creating Earned Impressions from social sharing. Maybe you can share the pages more yourself, or better promote those pieces of content.
5. See how SEO is doing
Look at your traffic sources and top pages. How are they performing, is there enough traffic coming in and is it staying.
6. Remove low performing pages
Go and look at pages that have low attention and engagement. Maybe they are outdated, or broken, or no longer useful. Consider removing them.
How does attribution tie into Website Analytics?
Attribution and website analytics go hand in hand. Often website analytics capture user behavior from marketing campaigns, that can then help attribute value to those programs.
In the shift to first party cookies, this did provide limitations on attribution for website analytics. Yet many solutions remain. Often using events, to see as a person leaves one experience, and using that as the measure of conversion.
A brief history of web analytics
Web analytics have been around as long as there have been websites.
Initially websites would use log level analytics, which helped webmasters see how many people were accessing their websites. Over time, the amount of bots grew, so this would mask the real website behavior, so new solutions were needed.
People then progressed to ‘Website Counters’ – actual counters on their webpage that visitors could see. And as each person visited, the counter went up by one. This was a fun era of hobbyist websites.
Urchin Analytics (and others) started using a javascript method, which the Web Browser would execute. This enabled marketers to get more data on how people were consuming their websites. And with a higher degree of accuracy. This paved the way for modern data analytics as we see it today.
Today, platforms are much easier to use, capture high fidelity data, which shows the customers behaviors.
For more, read the Wikipedia entry on Website Analytics.
What is the future of Website Analytics?
Websites continue to evolve, so must the technology that powers them. Some of the trends on the horizon:
- AI driven, using more AI to make predictions, to build cohorts, to find insight amongst all of the big data.
- Sort insight from the data, helping get a better understanding of what website users are doing and their behaviors.
- Helping with activation, using website analytics to activate customer behavior or integrated with CRMs. To offer more personalized experiences.
- Less data collected, working to reduce the amount of data collected, to ensure that only what is necessary is collected.
- Enhanced privacy, giving users more privacy controls.
How Nudge can help with Website Analytics
If you are considering a new analytics platform, explore Nudge and what it has to offer. Nudge is an analytics platform that seeks to capture customer engagement with your digital experience. It collects metrics on behaviors like engagement, scroll, drop off, engagement rate, conversion rate, attention, bounce rate. Collectively they provide a high fidelity view of the customers behaviors.
This data can then be viewed and analyzed in its online dashboard. Where extra analysis can be obtained, exploring geography, traffic sources, devices, customer journeys, top pages.
Further the platform creates insights from all of the data it collects. To help companies go from insight to action faster. The platform is easy to use, even for juniors on the team, and makes reporting a breeze. What good is data, if you don’t act on it? Nudge helps make it easy, so it is actionable.

|
|---|