Skip to content
At Nudge we regularly explore our data for new insights and best practices to share with clients so they can better plan for and manage Content campaigns.
In this report, we examine:
- Key metrics & benchmarks, distribution insights, content formats, engagement on social, and overall best practices.
- Lastly we highlight some great work we’ve seen in market. While these aren’t campaigns we’ve measured, they align with our best practices and we hope you’ll find some inspiration in them.
Key Metrics
The most valuable indicators of successful campaigns are Attention Minutes, Engagement, Avg. Scrolled and Earned Impressions Ratio.
Engagement (Social) is the ratio of social actions: sharing, liking or commenting on a piece of content. It evaluates the campaign’s performance in attracting people’s interests to interact with the content. Travel + tourism campaigns generally have a low engagement ratio (5.2%) compared to the overall benchmarks (18.4%).
Earned Impressions Ratio is the percentage of impressions that arise from a share over the total number of times people have viewed the content. Travel + tourism brands have a lower earned impressions ratio (8.6%) than Nudge overall benchmarks (51.3%).
Attention is the time that a person is actively consuming the content. People have spent an average of 0.98 attention minutes on travel + tourism branded content, 123% higher than the average benchmark, across all categories, i.e. travel audiences are very engaged.
Avg. Scrolled is how far people have scrolled on your content. The travel industry does a good job of getting people to consume their content, with an avg. scroll rate of 57.1%, compared to the overall industry benchmark of 53%. Now, layer that with Attention, and you’ll be able to work out that people are taking their time, scrolling and engaging the content before leaving. Had the attention been low, whilst scroll remained high, you could have safely assumed that people were skim-reading the content – however, this is thankfully not the case for the travel industry.
Distribution Insights
Traffic by device: Mobile 47%, Desktop 39%, and tablet 14%.
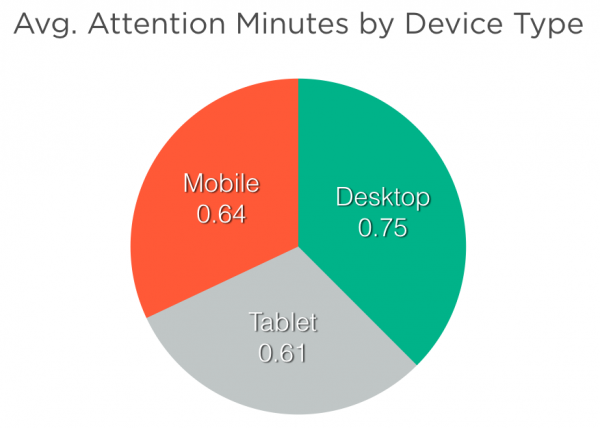
Even though mobile drives the most traffic, desktop tends to drive the highest Attention, so we’d recommend focusing efforts on driving traffic to desktop users.
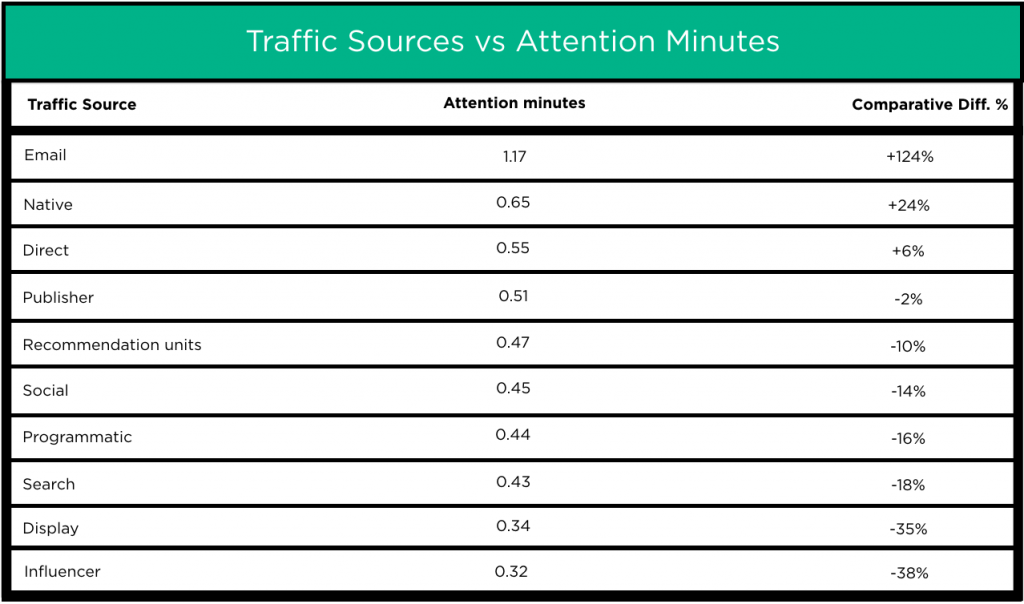
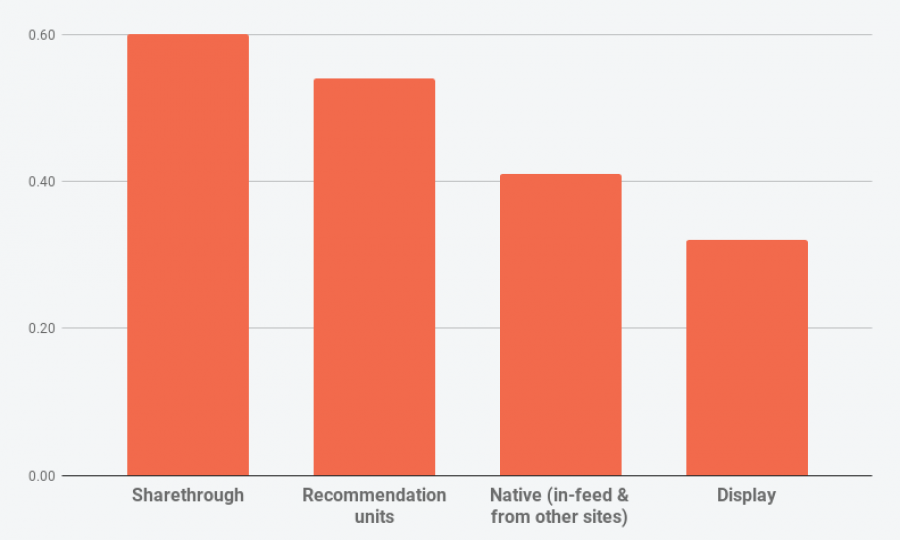
As seen above, Email newsletters are a great add-on to your campaigns, driving 124% higher attention (1.17) than the traffic benchmark.
- Tip: Put effort into scaling – ask partners to include this as a distribution source in your upcoming campaigns.
- Tip: Use as a tool to improve the overall quality of your campaigns.
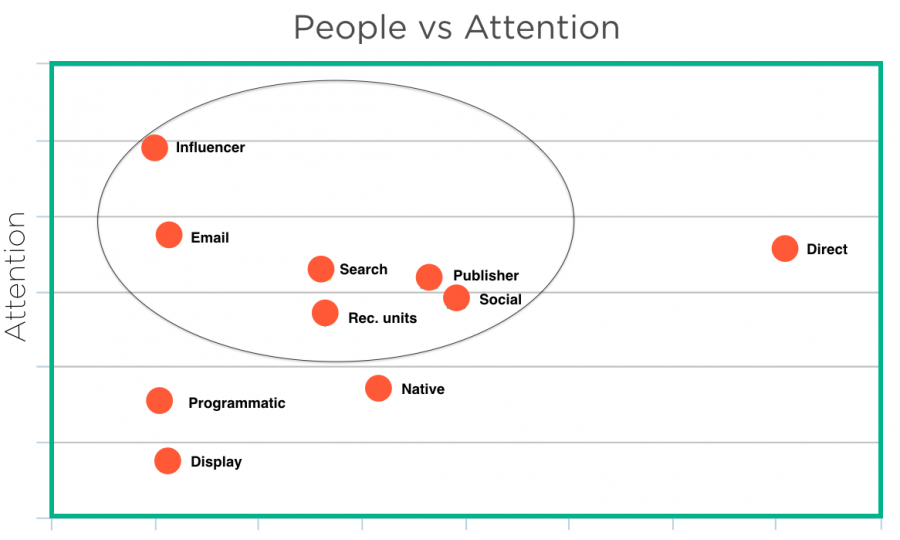
Native (in-feed & from other sites), is the second highest performing traffic source with 0.65 attention minutes.
Publishers (their own content) are below benchmarks for the travel industry, but we’ve also seen a bunch of examples showing that if you’re doing this well, you can really get some great ROI.
- Tip: Consistently link through to your own content, i.e. if it’s an article, you’d want to make sure you have call-to-actions in the beginning, middle, and end.
Social: You may be surprised that social isn’t performing better than it is. This is because marketers have a tendency to optimize towards the wrong metrics, i.e. towards the cheapest clicks, which aren’t necessarily the highest quality clicks.
- Tip: Focus on what happens beyond the click. Distribute to hyper-targeted, engaged audiences. Don’t just optimize towards the cheapest clicks.
Influencer: This was a surprise, as Influencers usually perform well in previous research. That being said, what’s clear is that when it’s the right influencer for your business, they still perform really well in terms of attention.
- Tip: It’s vital to pick the right influencer, i.e. they have a loyal following and an audience that’s of interest to you and your brand.
- Tip: Link through to your other content as these clicks are really valuable to your business.
More tips here.
Content Insights
While the most common content formats in the travel + tourism industry are lists, articles and videos, the data tells us that Quizzes, Video & Article and Lists are the best performing content formats by quality of Attention.
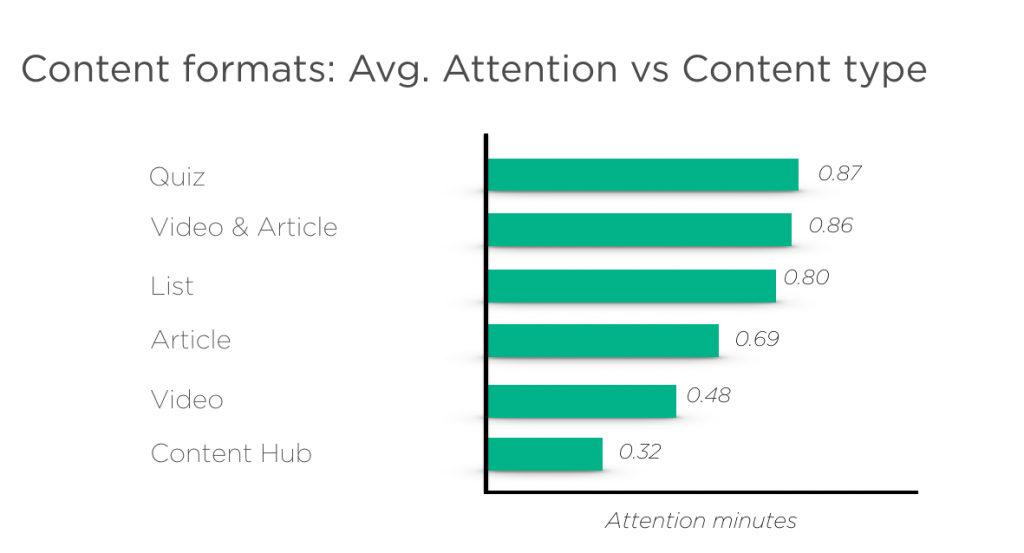
Content hubs perform badly, which is consistent across industries. They achieve lower engagement and lower attention than sponsored articles, placed within a publishers newsfeed.
Social Insights
Facebook is the current primary platform for social engagement in travel + tourism campaigns. It accounted for the highest social shares (91%), and generated 99% of earned impressions as organic traffic.
Twitter is the second best performing social media channel, driving strong earned impressions. In 2016 Twitter closed access to their API, which means that unless a user hits the Twitter share button on the page, no one is able to detect the share count.
Best Practices
– Before distributing across native channels, make sure you tag the content, so you can monitor performance. Not all native units perform equally.
– Always link through to the brands content from the publishers content, i.e. if it’s an article, you’d want to make sure you have call-to-actions in the beginning, middle, and end.
– Desktop drives the highest quality traffic. We would recommend focusing on targeting desktop users for the best results.
– Scale your email efforts – include this as a distribution source in your upcoming campaigns. Use email as a tool to improve the overall quality of your campaigns.
– For social distribution, focus on what happens beyond the click. Distribute to hyper-targeted, engaged audiences. Don’t just optimize towards the cheapest clicks.
– When running influencer campaigns, It’s vital to pick the right influencer, i.e. they should have a loyal following and be of relevance to your brand – otherwise it’s a lose/lose, when it should be a win/win.
– Quizzes, lists and video + articles perform the best in terms of attention. Focus your efforts here.
Campaigns We ❤️
If You’ve Done 10/14 Of These, You Know The Travel Loyalty Program Struggle
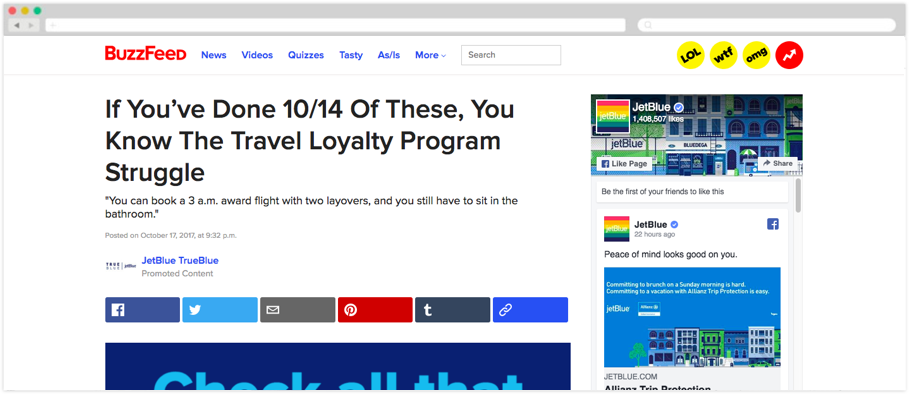
JetBlue on BuzzFeed: First out is a quiz (of course!). In this particular example, JetBlue + BuzzFeed have opted for a simple format, which invites the reader to interact with the content. JetBlue also educates their consumers about their loyalty program benefits in comparison to others. As we all know by having looked at the data, a quiz is the format that has the highest attention for travel brands. Well done, JetBlue.
American Airlines Celebrates Music’s Biggest Night by Raising 500k Miles For the Elton John AIDS Foundation
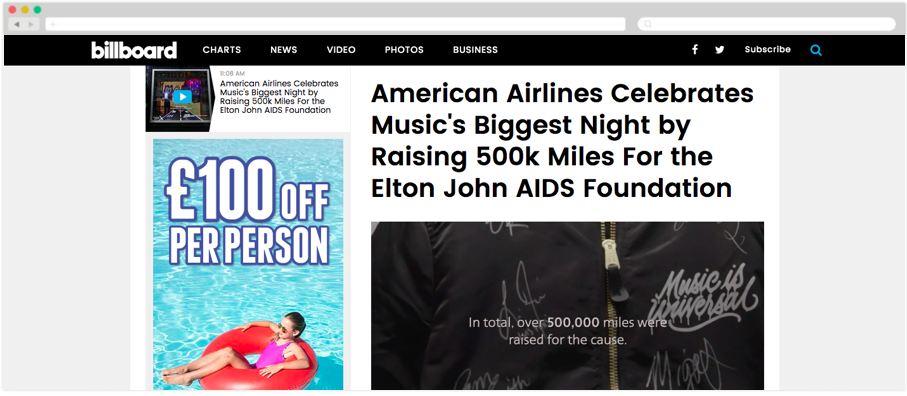
American Airlines on Billboard: This is a great piece by AA, where they celebrate Music’s Biggest Night by Raising 500k Miles For the Elton John AIDS Foundation. It’s also good to see that they’re using a video + article format, as we know it drives high attention and has in previous research (by Nudge) proven to increase conversions.
5 ways to vacation this summer — and where to stay
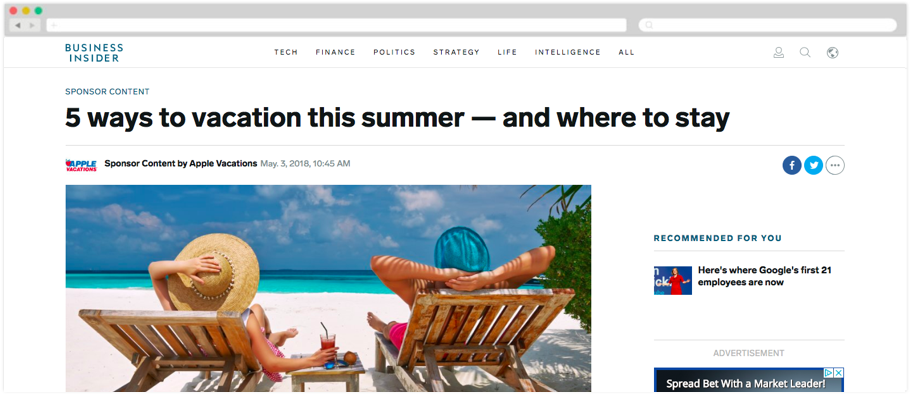
Apple Vacations on Business Insider: A nice list format, with a great story and tips. The article effectively elevates Apple Vacations brand throughout. Added bonus: the use of photos enhances the article as it paints a picture of what an Apple vacation is like.
Thinking of Traveling to Europe? 3 Trips That Will Change Your Life
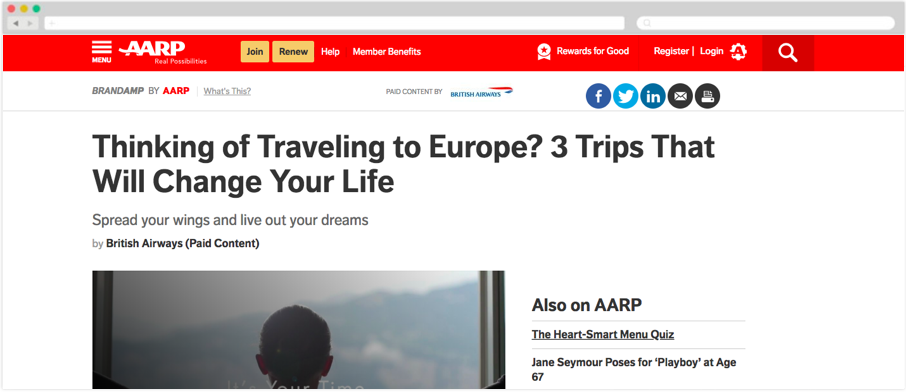
British Airways on AARP: Another nicely executed list, this time by BA. If you weren’t thinking of traveling Europe before reading it, you will be after.
By Thinking Like a Tech Company, Can an Airline Take the Stress Out of Travel?
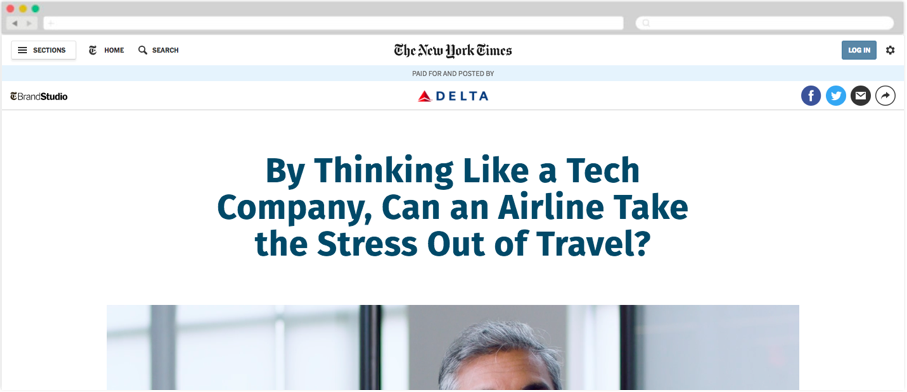
Delta on NYTimes: Everyone’s least favorite thing about traveling? The stress of it. Delta’s attacking it head on in this piece on the NYTimes, sharing how they’re reducing the stress in traveling by thinking and acting like a tech company. A great piece.
Give Me An Excuse To Upgrade
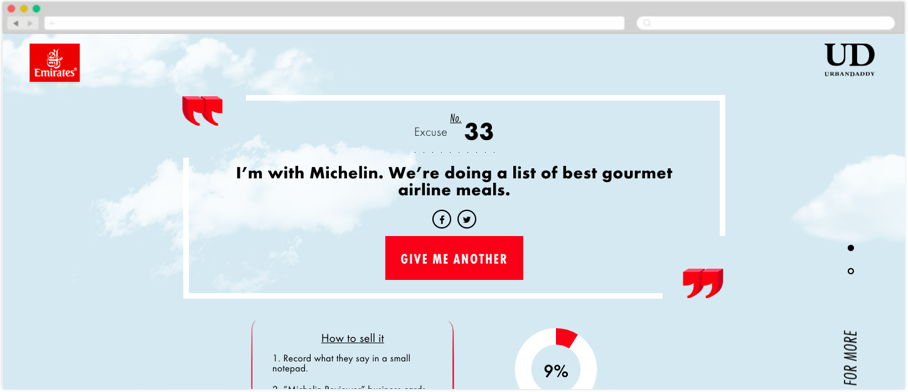
Emirates on UrbanDaddy: This is a clever piece by Emirates, which invites the reader to click a button to give them an excuse to upgrade their seat. It arms the reader with all the excuses necessary to elevate a flight. Fun, interactive and with a clear CTA.
10 Things You Know If You Love Hotels More Than Your Own Dang Home
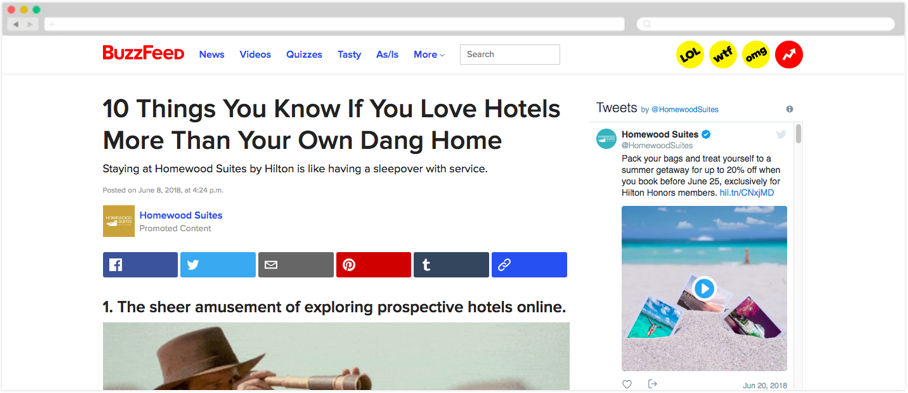
Hilton on BuzzFeed: A fun piece by Hilton. The gif + list format is BuzzFeed’s specialty and it works. The content is light-hearted and funny, whilst the brand itself is front and center.
Poke Bowls or Lobster Rolls? Pick Your Food Destination
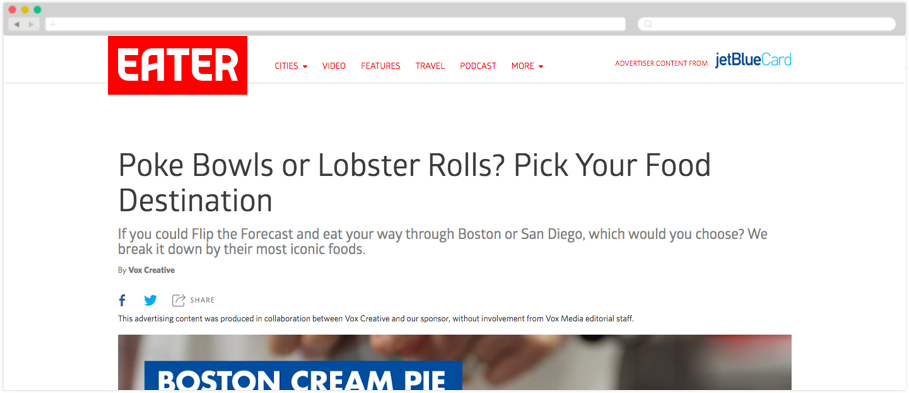
JetBlue on Eater: In this piece, JetBlue invites you along on a food journey across the US. We love the image slider, which enables you to compare iconic dishes across the country against one another. We ate 45 minutes ago, and now we’re hungry again… Great.
|
|---|