Ecommerce analytics is the process of collecting, processing and analyzing data around an ecommerce store. Depending on the tool used, this could be a combination of customer, web usage and purchase data. This post details an introduction to eCommerce Analytics.
This post includes:
- Common metrics used in eCommerce
- Example eCommerce analytics dashboard
- How do they analytics work
- How analytics increases sales
- Use cases
- Why are they important?
- What are the limitations?
- How to pick the best tool
Introduction
Ecommerce analytics help ecommerce companies better understand how their customer are engaging with their ecommerce store and marketing. The express aim is to help customers find products and services that suit their needs.
These analytics tools take the feedback from customers and prospective customers, analyzes them and shares the performance in an online dashboard. In a way they are the voice of the customer.
Analytics is used to help establish a baseline performance and identify opportunities for improvement. To deliver on growing sales for the store.
Common metrics used in eCommerce analytics
Common metrics that eCommerce marketers use:
- Conversion rate, rate at which people take the desired action, add to cart, or purchase.
- Bounce rate, are people staying, but use a bounce rate that captures if people leave even without clicking a link. Like Nudge does.
- Attention, how long people are engaging on each page.
- Average Scroll, how are customers consuming the page and content. Identifying hot zones or low areas of engagement.
- Engagement rate, what customers do on the page, and if they click out, to make a purchase, or sign up to webinar etc.
Additional slices of data, like Time of Day and Day of Week, help to uncover hot spots in demand. Paired with traffic sources and devices, analysts can get a high fidelity of where to optimize.
For example, for a furniture store, focusing on the mid morning and afternoons in the weekends, might were more effective times for their customers.
Product listings are content, content that helps attract, educate and convert potential customers.
This can be an area that eCommerce stores can find easy and tangible improvements that help drive more traffic and conversions.
Related reading:
- Guide to Conversion Rate
- Best Website Analytics 2023
- How Nudge helps eCommerce
- Guide to Content Marketing Analytics
An example of an ecommerce analytics dashboard is below:
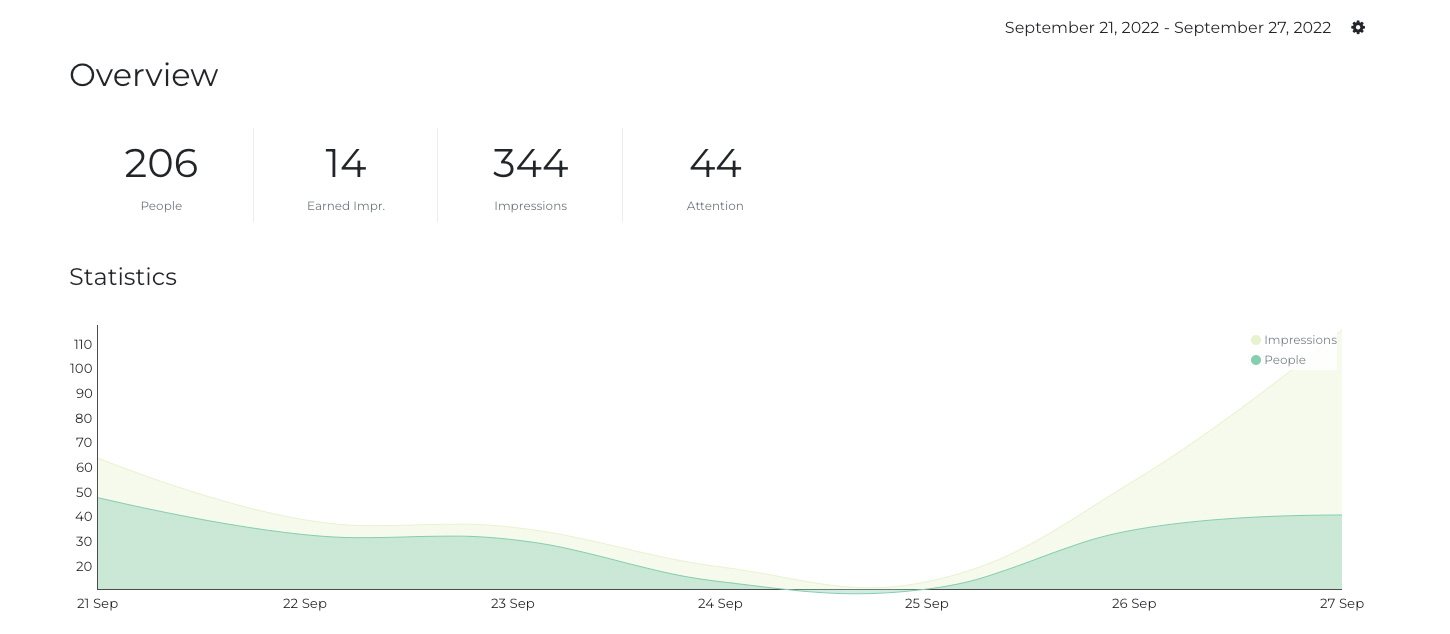
Nudge provides analytics on how many customers came to the store, what products they looked at, seriously considered and then purchased.
Often stores are using web analytics for their main analytics, with additional features to see how behavior drove purchases. Increasingly firms are using attention analytics, to really see what customers are paying attention to.
eCommerce platforms themselves offer their own analytics, such as Shopify Analytics. This helps close the loop with your web analytics.
How do eCommerce Analytics work?
Typically a piece of code is placed into the source code of the eCommerce website. This enables the analytics system to analyze visitors and shared the information in an online dashboard.
This includes metrics and analysis on the performance. Often eCommerce software like Shopify or BigCommerce have options to easily install additional code to activate these tools.
An overview of what Shopify Analytics provides is here.
How analytics increases ecommerce sales
Analytics help increase conversion rates by giving an enhanced understanding of customers behaviors, what they like, where they come from. This is the best place to start when growing sales.
You either want to find more customers like them, or if you have saturated that channel, find new channels for customers.
This is why analytics is so important for increasing sales. There are likely opportunities right in front of you that can be acted upon. You just need the right tools to help find them.
Use cases for eCommerce Analytics
Companies can use analytics to help find:
- The best converting products.
- What product listings need improvement.
- Establishing a scorecard of performance.
- Identifying high quality and low quality traffic sources. Improving PPC, search and SEO efforts.
- Identifying pockets of consumer demand, days of week and times of day, to focus on.
- Creating benchmarks.
Why is eCommerce analytics important?
Without analytics they would be operating in the dark. Analytics provides a voice for the customer, by measuring their actions and sharing that feedback through their analytics tool.
Online retail is competitive, and if a competitor is able to get better intelligence about the market and increase performance, that can come at the cost of your sales.
What are the limitations of eCommerce analytics?
In reviewing any data on performance, it is worth understanding what the limitations of that dataset are. Otherwise you could make the wrong sorts of optimization decisions. For example, running tv ads, increases searches, which then leads to higher converting sales.
You might misinterpret the increased search volume for a permanent effect, where in reality it is temporary. And part of that lift in sales needs to be attributed to that tv action.
Simply viewing your web analytics wouldn’t tell you that whole story. Which is why continuing to map the whole marketing activity landscape and connect the dots is important.
How to pick the best tool
The best tool is the once you use, a bit of a cliche but it rings true. The best analytics tool is the one you use. So leverage free trials or demonstrations to find the capabilities that will help deliver on your goals.
Often an analytics stack is going to look like a mix of:
- Website and/or content marketing analytics
- eCommerce Platform built in analytics
- External market facing data around DTC or eCommerce trends.
In our guide to Best Website Analytics Tools in 2023, other factors to consider:
- Speed of the code, as this means more data is captured from more customers.
- Install base
- Ease of use
- Rate of feature and improvements made
- Privacy
- Sampling and/or accuracy of the data, some companies trade off accuracy by sampling data.
..

|
|---|