Engagement analytics is the process of tracking, measuring and processing of engagement actions on a webpage. The data is then shown in an online dashboard.
Why are Engagement Analytics important?
Seeing how audiences engage, rather than passively view, a webpage or piece of content, helps to understand what is going to drive demand. Audiences seek out & share engaging content. Thus companies want to be able to tell if their content is engaging.
In 2023, Google Search algorithms have been aggressive in promoting (and de-ranking) content based on how helpful it is to the user. Engagement metrics help provide a feedback loop of how engaging any particular webpage is. Thus engagement metrics have become very important.
Engagement analytics help inform:
- Content creation strategies & content optimization decisions.
- Optimizing traffic sources and content distribution.
- Adjusting advertising mix, weighting and optimization.
- Content studios, who work with brand partners to create content.
- SEO strategies, to improve content quality and performance.
- Customer experiences & insights, to measure the success of an experience.
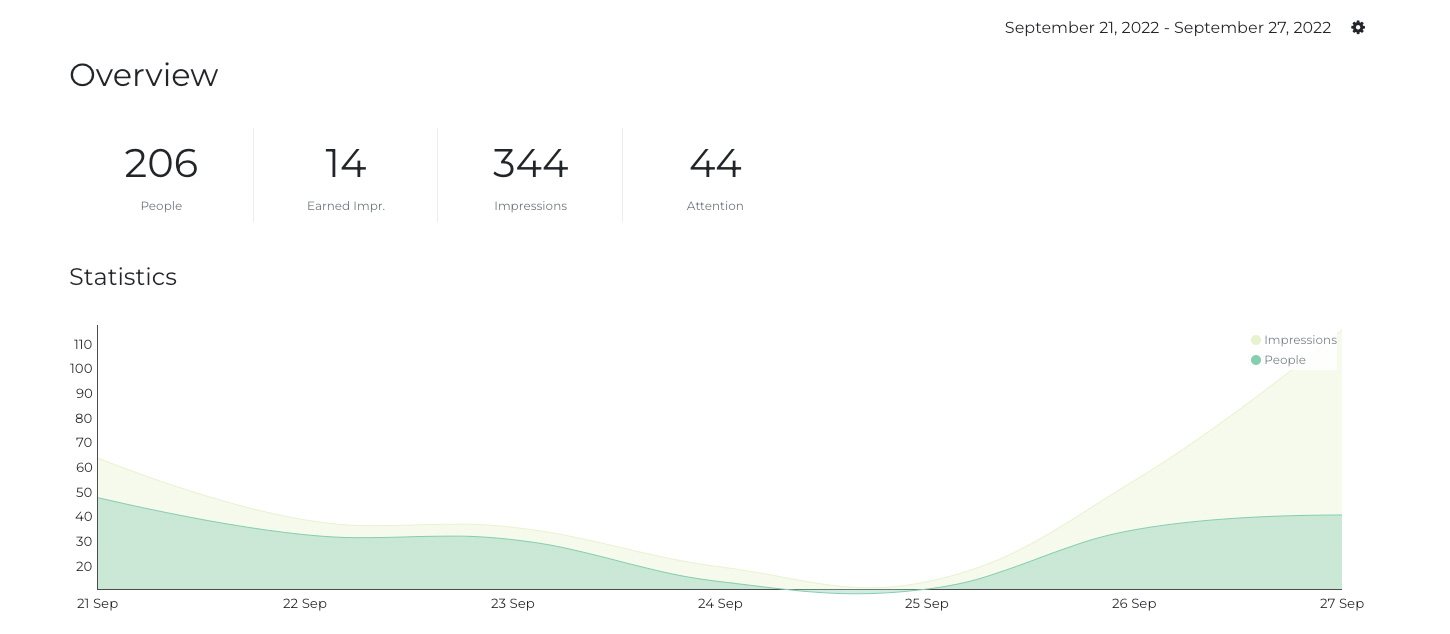
Example of an engagement analytics dashboard.
Common Engagement Metrics
The most common engagement metrics are:
- Attention, measuring second by second engagement on a page.
- Scroll metrics, seeing how far people scroll down a page. Or scroll drop off, where users drop off.
- Engagement actions, for example like buttons, emoji responses, comments or sharing.
- Attention Thresholds, percentage of the audience that hit a threshold of say 3 seconds, 5 seconds, 10 seconds.
- Engagement rate, what customers do on the page, and if they click out, to make a purchase, or sign up to webinar etc.
- Conversion rate, rate at which people take the desired action.
- Bounce rate, are people staying, but use a bounce rate that captures if people leave even without clicking a link. Like Nudge does.
This data is usually shared in a real-time dashboard, which provides early and fast feedback.
For many, this is often thought of as content engagement analytics. Agencies can use these as KPIs for success on branded content & advertising campaigns. Publishers use them to establish quality of their content and to demonstrate the efficacy of their content. Marketers use them as a feedback loop and to prove out success.
Related reading:
How do you measure engagement analytics?
Typically a piece of tracking javascript is provided by the analytics tool. This is installed on the webpage and enables the analytics platform to collect the data on users. This is then showed in the online dashboard.
Nudge is a great tool for collecting engagement analytics, it collects scroll data, attention, engagements on page and attention thresholds. This data can be sliced by URL, device, geography, traffic source and more.
What is a good engagement rate?
This varies depending on the definition of engagement rate. However most that are asking this question, are looking at those that take an extra step after visiting a URL, in that you can expect from 3%-14%.
Content created for broader audiences will tend to be at the lower end of that engagement scale. Higher engagement would come from more specific and focused experiences or content.
Engagement rates at 0.5% would be considered lower performing, as if the webpage has been designed for an audience, it should create engagement.
..

|
|---|