Nudge is a web analytics platform that is focused on attention and engagement from audiences. Tracking scroll metrics comes out of the box. Read on to see how to enable scroll analytics for your experience.
You might use this for content marketing, native / programmatic advertising or just understanding how audiences scroll through your pages.
Sign up to Nudge
- First you need to sign up to Nudge, click the sign up button.
- Enter your email and a password, or log in with Google.
- Enter the domain that you want to track.
- Nudge will then give you a tracking code. Install that code on your website.
- Check back to see your scroll data.
- Visit a particular URL.
- And scroll down, you will see your scroll metrics. Telling you a lot of useful information.
The scroll metrics
You will see a visualization like this, which you can interact with. This lets you see how long it is taking users to scroll through the page, areas that are getting more attention.
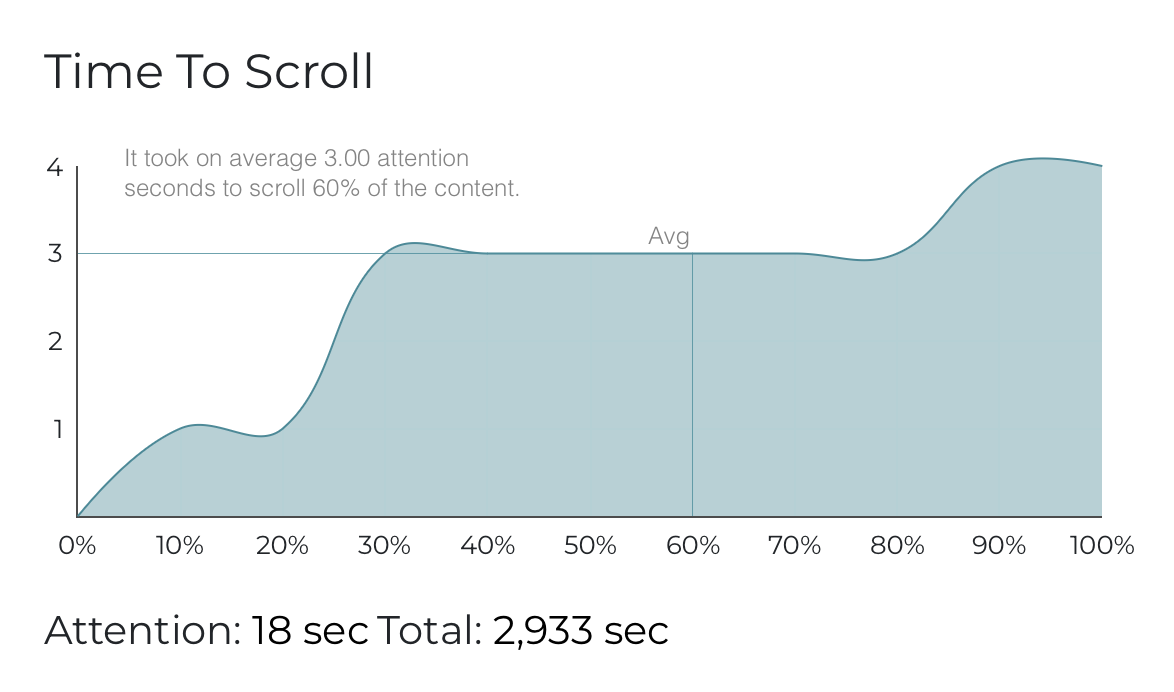
The time to scroll visualization tells you a lot of pertinent information:
- What your average attention is, so you can tell if this piece has a low (or high) attention, which the scroll behavior may be impacting.
- What the average user is doing, you can move that positioning up and down, to see how long it is taking users to reach certain points on the page.
This is useful for:
- Finding where to place calls to action or engagement units on the page.
- Diagnose attention or other low performance issues.
- Compare content.
- Reporting on your scroll metrics.
- Creative feedback, to understand what is most engaging for users.
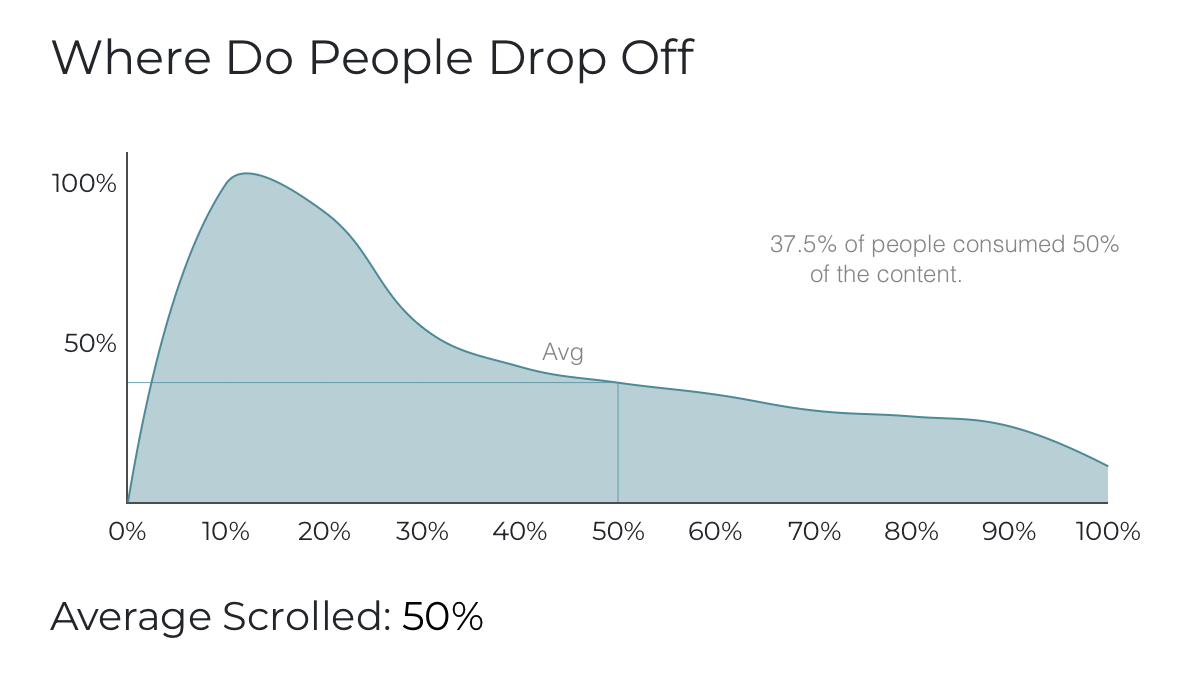
The where do people drop off visualization tells you:
- What the Average Scroll across your whole audience.
- What percentage of your audience reached that point.
- The shape of the curve helps identify where people are dropping off, a curve to the left like this, suggests people are dropping off or clicking away fairly quickly.
- Moving the cursor up and down, lets you see how people behaved at that point.
Scroll and Attention are intertwined
Scroll metrics and attention are intertwined, because to have scroll, you must be paying attention. So low scroll, usually means low attention. And then low attention means a lower conversion rate.
That’s how everything is intermingled.
Related reading:
Uses of scroll metrics
There are many uses for scroll metrics:
- Comparing the performance of content marketing or branded content.
- As a quality metric, KPI or scorecard for advertising and marketing campaigns.
- To identify the performance of a particular URL.
- To inform creative & content strategies.
- As a target for content partners.
- To measure ad quality.
- To identify traffic source optimizations or quality.
- Content benchmarks.
FAQ
What is scroll analytics?
Scroll analytics is analytics that helps measure and analyze scroll depth and other scroll metrics on webpages, content and other digital experiences. Nudge provides scroll analytics as part of its platform.
How does scroll analytics work?
A piece of javascript is placed on the page, which analyzes which part of the page is in view for each user. And sums up this data in an online dashboard.
What is scroll analytics important?
Knowing what part of the page has been in view helps understand how effective the page has been. And/or the traffic sources or campaigns driving traffic to that page. It enables analytics folks to then action changes, to maximize scroll and other forms of engagement.
..
This is part of our Guide to Scroll Depth.
..

|
|---|