Digital marketing analytics is a process for organizing, collecting & analyzing data from digital marketing activities. The performance and insights then inform data-led decision making.
Here is a 7-step guide to making the most of your digital marketing analytics.
1. Start with the business objectives and digital marketing strategy
Understanding what digital marketing is trying to achieve first and foremost.
2. Find the metrics which suit those objectives
Zooming in on the most suitable metrics to measure helps the team focus on the right things.
These metrics can become your KPIs or part of your internal scorecard for success. If you are working with partners, make them part of the process to select these.
3. Implement the measurement
Implement the analytics across your digital marketing mix. Complete QA to see that it is tracking as intended.
To do this effectively, make sure you allow time for this. Rushing it can lead to mistakes and unintended consequences. This is a continuous process to keep the right metrics and measures.
4. Collect data
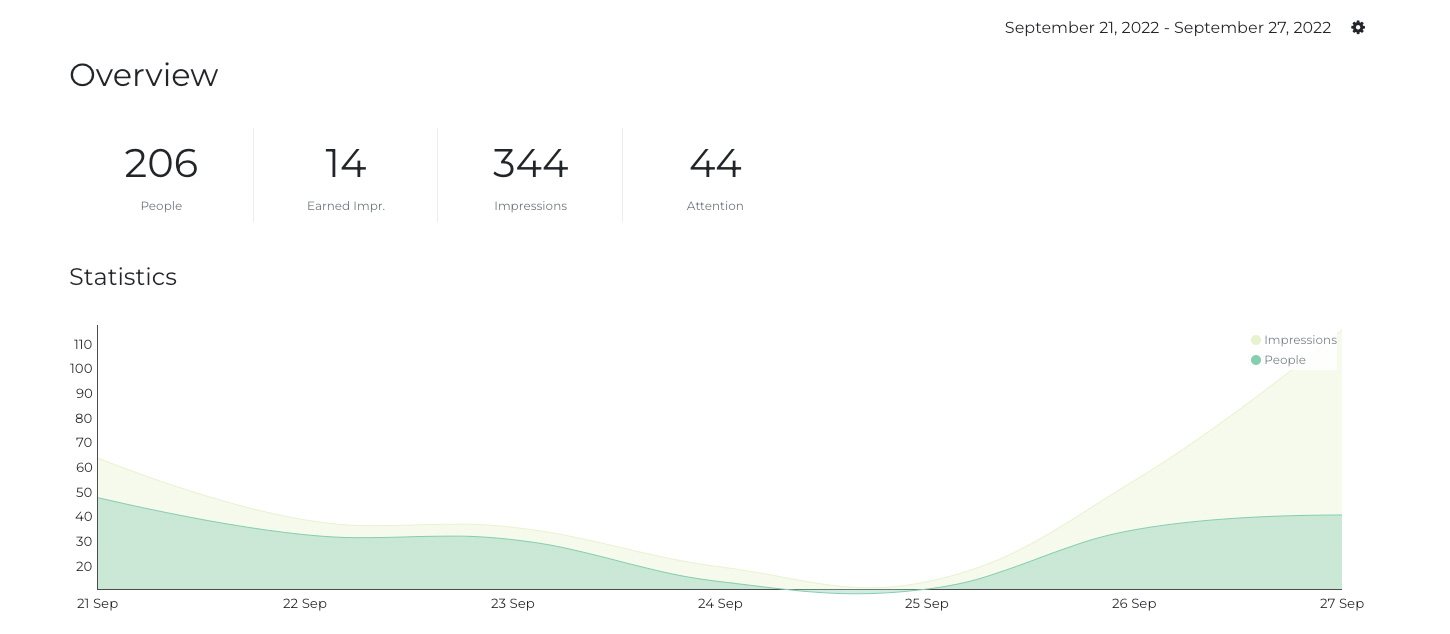
Each day, you can see how data is coming in, in your digital analytics dashboard.
Many platforms can send you custom reports. Or an analyst can prepare them for you.
5. Make adjustments
Depending on what is meaningful for your work, making adjustments each day, week, or month. It’s about striking a balance depending on how long your content is in market. For shorter campaigns, you may want to adjust more regularly.
For longer-term campaigns, making adjustments each month might make more sense.
6. Create reports
Creating reports helps uncover areas of opportunity and holds the team accountable. They are also vital in helping other stakeholders understand how content is driving performance.
This is an area where the value can be overlooked. But the act of putting in a report, on a regular cadence, helps the team continuously improve and keep performance in mind.
7. Reflect/review/inform
Once a quarter, doing a workshop to look at all the data, reports, and work. Then analyzing it to find trends, wins, areas of improvement.
This helps to prove out ROI but also provides data to predict how future content investments will perform.
A pro-tip is to change the team creating these reports over time. This helps spread the intelligence and knowledge amongst the team, gets fresh eyes on the data, and helps keep everyone fresh.
Related reading:

|
|---|