Effortless insights
Measure the right things, get insights, make changes & drive performance.
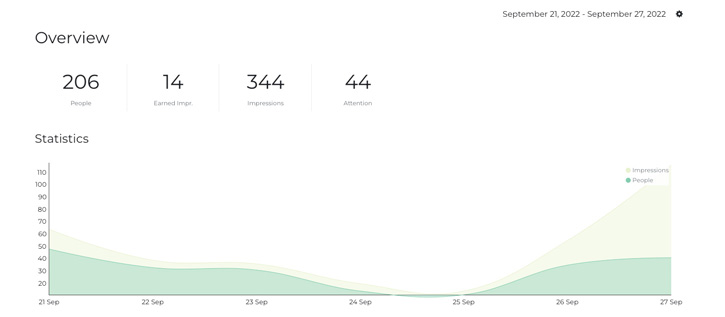
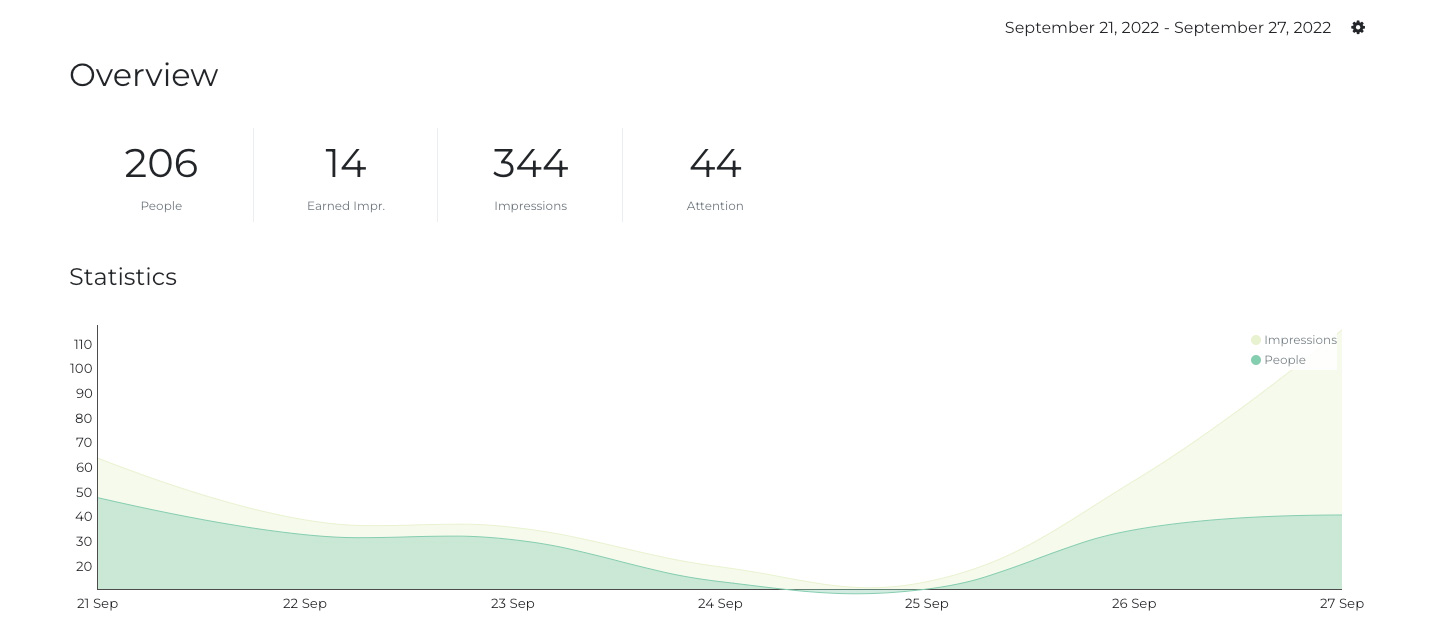
70%
of new users get set up in under 10 minutes.
39%
faster code than traditional analytics.
1
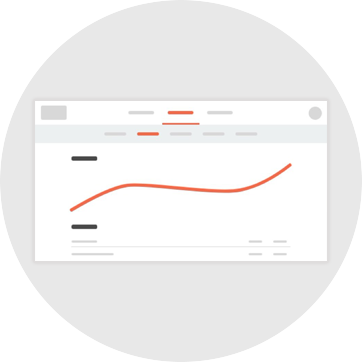
easy to use dashboard.
The Intelligence Era ✨
AI, ML, Attention Models and more. We are building the next generation of analytics products based around our attention model.

- Learn morehow this changes everything.
What makes us different? Attention
Every second 2.44% of your audience leaves. Nudge measures attention on the same basis, second by second.
Then combines attention with metrics like scroll, drop off, urls, traffic sources & attribution.
The best of the best in one place
It’s like we merged your advertising analytics with your content, heat map & site metrics.
Our analytics offer effortless insights, powered by real-time data, no configuration needed.
- Explore featuresMetrics you can’t get anywhere else.
- Explore pricingStart for free, upgrade anytime.
We've measured thousands of brands
How it works
You’re only steps away from getting new metrics.
1. Enter your domain
2. Copy and paste the tracking script
3. Get data & insights
Docs

There’s no time like the present to get started.