

Download the full report here.
Before you read the full report, the key findings were:
1. Sharethrough is a higher quality source than Recommendation units by 10.5 percent, and Native by 37.6 percent.
2. Sharethrough’s native ads outperform traditional display ads by 61 percent.
3. When comparing the difference in quality between Sharethrough’s mobile traffic to the Global mobile traffic standard, the result is a staggering 83 percent.
4. Social Media is a top quality traffic category, but buyers should pay close attention to future algorithm fluctuations.
Click the links below to jump to a specific section of the report.
- Executive summary
- Research methodology
- Sharethrough results
- Keynote outtakes from the report
- Nudge, a word on what we do
- Appendix
Executive summary
For a long time, buyers have had to make do with fickle and misleading vanity metrics in order to make up their minds about where they should spend their precious distribution budgets.
As Tim Ferris once put it, ‘Vanity metrics: good for feeling awesome, bad for action.’
To shed light on a more telling and actionable metric for content, namely Attention Minutes, we grouped millions of paid clicks to content into four traffic categories (i.e. Social, Display, Native and Recommendation Units) and evaluated each of them through a traffic quality lens. After conducting broader category assessments, we compared each category against traffic driven by our native distribution partner, Sharethrough.
Sharethrough is a pioneer in the native advertising space, and over the past 12 months, they have measured 804 native campaigns with Nudge.
This report reflects our partnership to date. It also shows that Sharethrough is a better buy (based on traffic quality), compared to other competing traffic categories.
By understanding the quality associated with certain traffic categories, buyers can use the findings in this report to shape their distribution strategies to get more bang for their buck.
Research methodology
Attention Minutes is the best way to measure quality
Attention Minutes is a metric that tracks every second that a person is actively consuming your content, discounting the empty clicks. Because not all clicks are created equal.
For context, picture this scenario: a user clicks on your article, reads it for three minutes and hits the back button. With Attention Minutes, this time on page counts, whereas, with traditional page analytics, this behavior would be counted as a Bounce.
This is helpful because it enables marketers to truly understand which traffic sources are driving quality audiences to their content. And by slicing Attention Minutes by traffic sources, placements, creatives, etc., marketers are able to adjust their distribution budget to back the winning combination.
Higher Attention Minutes leads to higher Conversion Rates
Whether a brand’s goal is to increase brand lift, awareness, purchase intent, consideration or actual sales, using attention as your scorecard is the best identifier of value. Because attention will create all of those outcomes. It tells you the traffic is doing its job.
For this study, we looked at
- US-traffic over the past 12 months.
- Content and device types: All formats and devices.
- Data threshold: We introduced a traffic threshold per category of 1000 people, to ensure we’re only analyzing clear trends.
- We calculated the ‘percentage difference’ between Sharethrough and other traffic categories, rather than the ‘percentage increase’. The reason for this being, we are making comparisons within channel differences, not against global traffic trends. Our intent is always to achieve the greatest reporting accuracy possible.
- To extrapolate the highest/lowest quality traffic sources, we pooled both Sharethrough’s and the rest of our clients’ distribution data into categories.
- For more on this method, see appendix.
Limitations of our approach
We haven’t done direct competitor framing. Showing how Sharethrough stands out against overall traffic categories is a more compelling point of view. However, Google, OutBrain, Facebook and many others are included in the mix.
The post-click data is strictly from clicks to content.
Sharethrough Results
We compared the average Attention Minutes from Sharethrough traffic against the following traffic categories:
– Recommendation units (e.g. Outbrain)
– Native (i.e. in-feed and from other sites)
– Display (e.g. Google Ads)
– Social Media (e.g. Facebook)
#1 Finding: Sharethrough is a higher quality source than competing traffic sources.
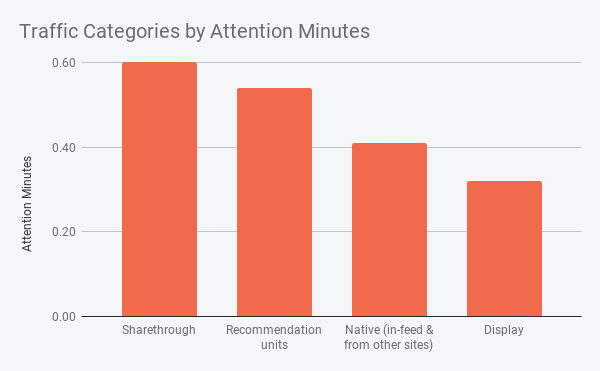

Sharethrough is a higher quality source than the Recommendation units, Native (in-feed & from other sites) and Display categories as a whole.
This data enables buyers to make informed decisions and helps inform how to bid and allocate budgets.
#2 Finding: Sharethrough is outperforming the Display Category.
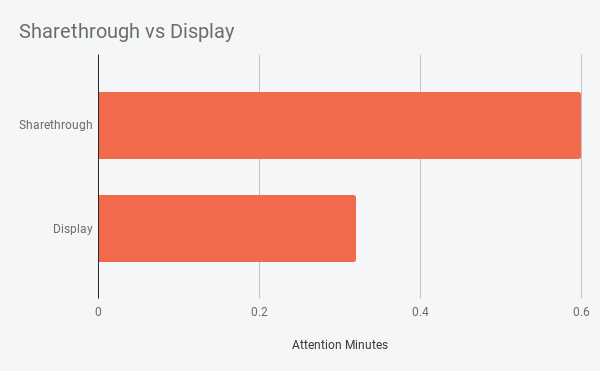
When comparing Sharethrough against the Display category, it’s clear that Sharethrough is magnitude times better.
#3 Finding: Sharethrough is a high-quality mobile traffic source.
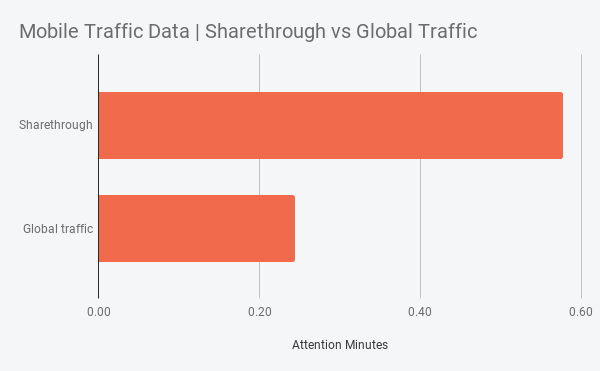
The difference in quality between Sharethrough’s mobile traffic and Global mobile traffic, is a staggering 83 percent in Sharethrough’s favor.
#4 Finding: Social Media is a top quality traffic category, but buyers should pay close attention to future algorithm fluctuations.
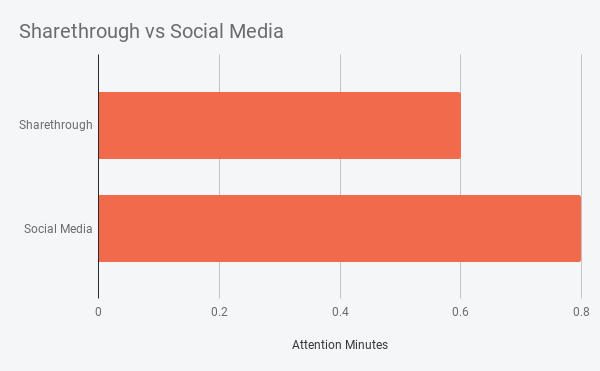
Social Media, over the past two years, has gone from being a poor quality traffic source, to delivering Attention Minutes 2% above benchmarks.
In 2017, Social Media’s average Attention Minutes were 0.48 minutes, but in 2018, it increased to 0.72. A trend that has continued over the past 12 months. Social Media is now delivering an average of 0.8 Attention Minutes.
A big reason for this development is that Facebook has significantly reduced the amount of clickbait on their platform. This has improved the overall quality of this traffic category.
During the same time frame, however, Sharethrough’s traffic quality has remained steady (0.6 Attention Minutes in 2018).
As a buyer, don’t be held ransom to the algorithm.
Keynote outtakes from this report
- Sharethrough is a higher quality source than Recommendation units by 10.5 percent, and Native by 37.6 percent.
- Sharethrough’s native ads outperform traditional display ads by 61 percent.
- When comparing the difference in quality between Sharethrough’s mobile traffic to the Global mobile traffic standard, the result is a staggering 83 percent.
- Social Media is a top quality traffic category, but buyers should pay close attention to future algorithm fluctuations.
Nudge, a word on what we do
Nudge provides measurement and intelligence for content-first brands and their partners. We aim to serve buyers and sellers of media, looking to illustrate ROI, generate deeper performance insight, and save time. We are able to do so by…
- Focusing on post-click engagement by measuring content across the open web, within the “walled gardens” (Facebook, Instagram, Youtube), and across programmatic distribution networks.
- Providing real-time metrics such as depth of scroll, Attention Minutes, conversions, and more.
- Reporting on quality of traffic from each distribution source.
- Providing industry-specific benchmarks.
- Producing real-time insights and recommendations with an eye towards optimization.
Advertising and Media are going through upheaval. Brands are acting as Publishers, Publishers are acting as Agencies, and Agencies are trying to do it all. All parties are demanding transparency, and greater accountability from each other and their partners across the ad tech industry.
Nudge was built to provide the clarity that is necessary for the time we’re living in now, when Content becomes Advertising.
Simply put, we combine best-in-class technology with a world-class support team to ensure success. Our simple dashboards make accessing metrics and intelligence easy and actionable. And we’re always listening and improving to adapt with the market and capture new opportunities with our clients.
Appendix
Research methodology
We categorized 35 million paid clicks to branded content to establish which traffic categories have been driving the best quality traffic to content. Filters included:
- US-traffic over the past 12 months.
- Only human based engagements (no bots, we filter those out automatically).
- Content types: All formats.
- All industries, but our top five are technology, finance, food/drink, travel & tourism, and health & fitness.
In order to extrapolate the highest/lowest quality traffic sources, we had to pool our clients’ distribution data into categories.
The categories covered in this study include:
Display (e.g. Google, Bing, Yahoo, etc.), Native (in-feed & from other sites), Social Media (e.g. Facebook, Instagram, Twitter, etc.), and Recommendation units (e.g. Taboola, Outbrain, etc.)
We then compared Sharethrough’s traffic data against the aforementioned traffic categories.
Relevant links
Nudge capabilities
Nudge terminology
Implementation & knowledge base
Why content, data points & ROI
The latest native content campaigns
For any questions about this report, contact [email protected].
Download the PDF version of this report here.

|
|---|