Analytics, but better.
Taking analytics where it hasn’t been before, content first and in multiple places at once. Nudge is built from the ground up for privacy, so you protect yours and your visitors data. Explore how your customers interact with your content.

New metrics fit for content.
You’ve never seen content analyzed like this before. See social engagement on non social media content, scroll and drop off. And attention, measured in seconds. These finer details tell you more than how many people saw your content they tell you if they cared.
63
Attention
2,300
People
250
Shares
14%
Engagement
5%
Virality
578
Earned Impressions
58%
Average Scroll
14%
Bounce
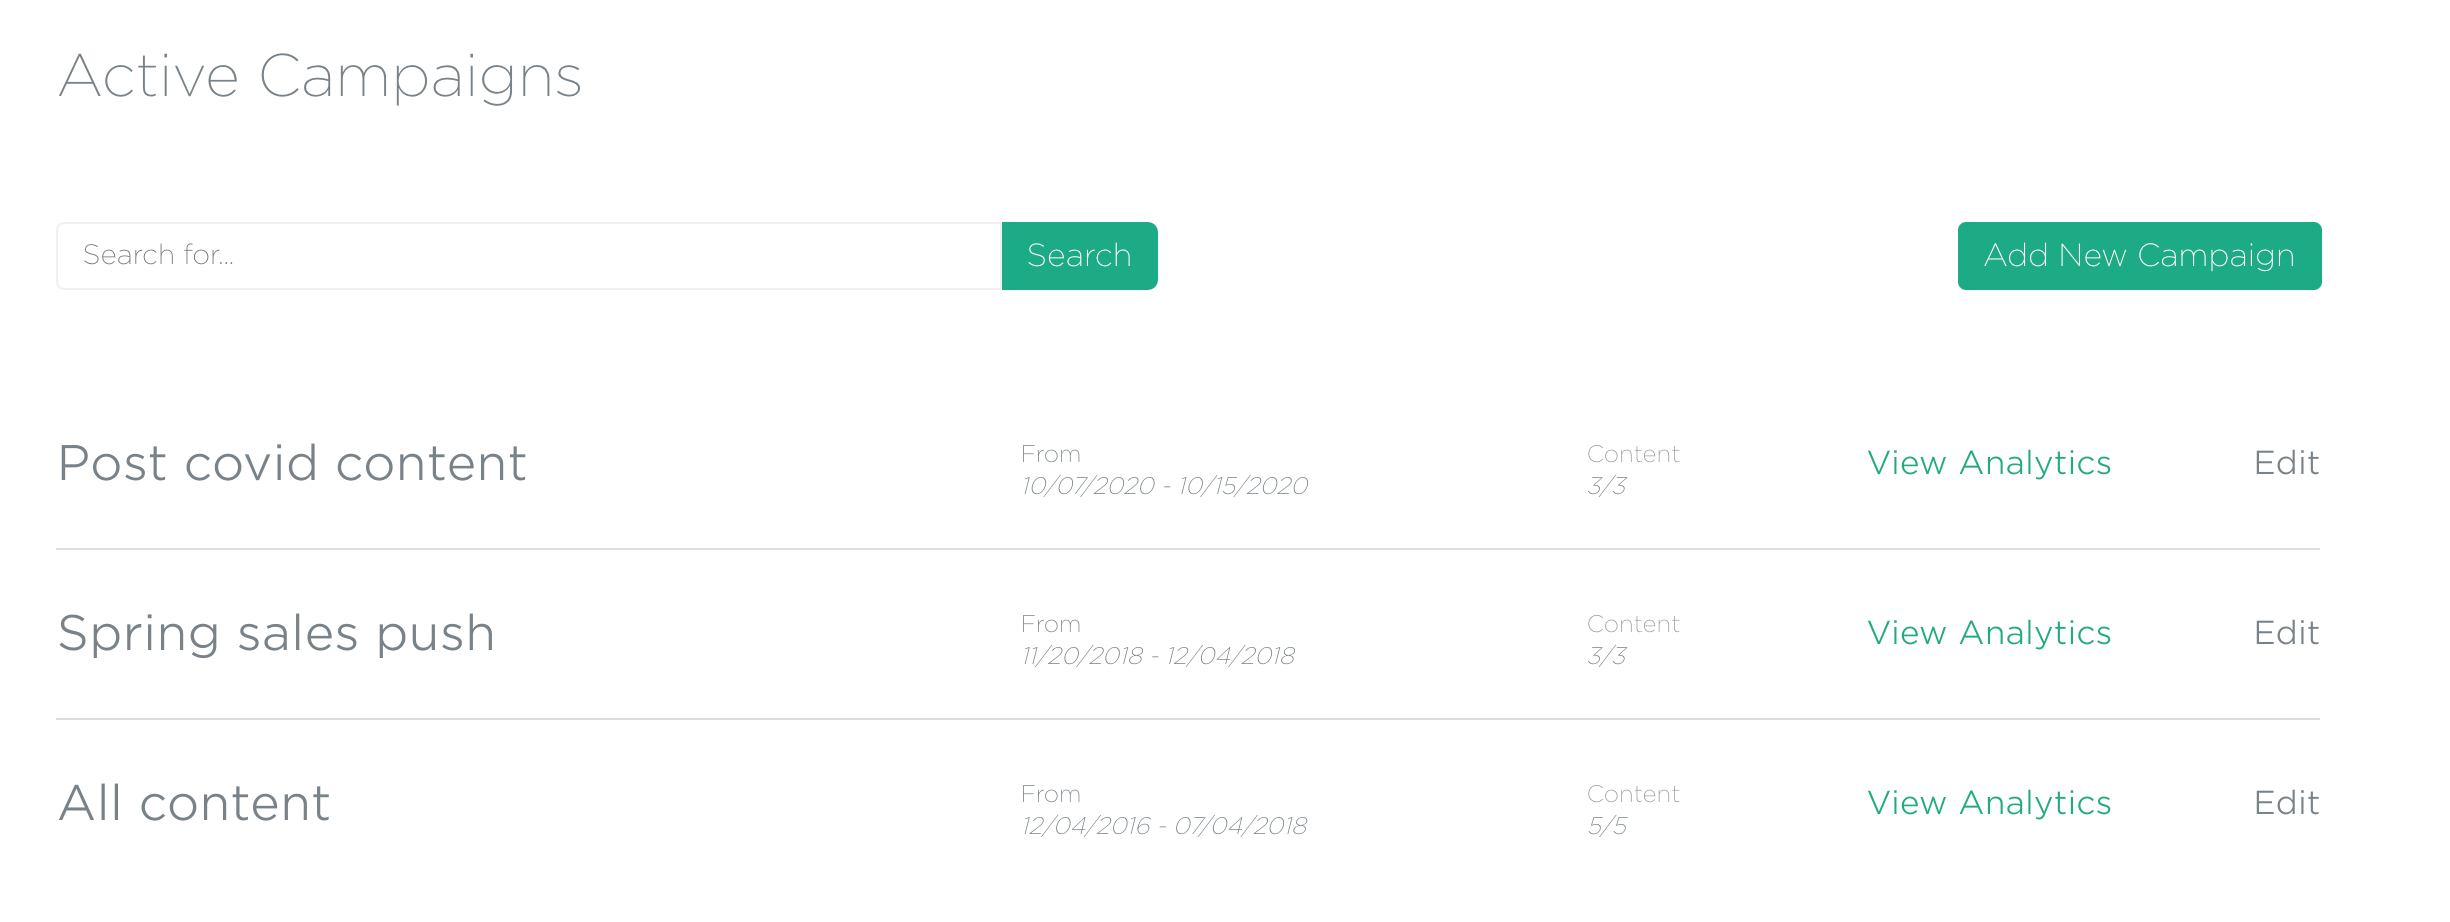
Metrics you know, improved.
With simple metrics like People and Bounce rate, improved to give greater fidelity on what’s really happening. Expand that to split by device, traffic sources and you get the best of what you used to get and more.

13,820
People
9%
Bounce
Insights as if you wrote them.
Nudge creates insights from the data just like a fancy stock report. Copy/paste, share, just in time for that last minute meeting. Or even read directly from the dashboard. No more last minute report surprises with Nudge.
- LinkedIn is the best social media platform, as well as performing the best. 4.95% of readers accessed the content through this source, yielded 1.63 average attention minute(s), and a bounce rate of 0.00%.
- Mobile has accounted for 52.09% of total traffic, followed by desktop with 34.04%, and tablet with 13.87%.
- There's been over 72403.40 total attention minute(s) spent with your campaign to date.
- Mobile has accounted for 52.09% of total traffic. It has also yielded an average scroll rate of 54.28% and average attention minutes of 1.20 minute(s). We would recommend focusing on mobile promotion for best results.
- People scrolled 57.91% of the content on average, and had an average attention of 1.26 minute(s). These values are both higher than the Nudge platform benchmark, the scroll is 9.26% higher, and the attention is 58.26% higher. Your campaign is running very well!
- The highest reach in a day was at 08:00 AM, and the highest attention was at 08:00 AM. We would recommend to focus on these times to maximize performance.
A dashboard anyone can use.
Our users spend up to 6 hours/week in and out of the dashboard. Try it yourself, it’s addictive and easy. Pick it up and go, just like those iPhones we all know and love.
Extendable, add your custom events.
Define your own events that you’d like to measure. Custom KPIs, emoji clicks, expands, do it your way and link to all the other data you get from Nudge.
Did you enjoy this content? 👍 👎
onclick="ndg('thumbsup');"
onclick="ndg('Add to cart');"
We created a new version and you can download it on our blog.
onclick="ndg('Blog download');"
Get started with one line of code
The proprietary Nudge line of code is snappy, fast and resilient to capture the most high fidelity data in a privacy safe way. Once your code is live, so is your data, log in and see how your content performs.