 Skip to content

Summary
An article on DigiDay concluded that only 9% of marketers are very confident about their native ad metrics.
With this in mind, Netflix’s well-documented investments in Wired and the New York Times native ad products provides an opportune case study to bring these measurement challenges to life. This white paper is meant to help brands evaluate their own native ad investments and learn more about native ad measurement.
Using our native ad measurement technology, Nudge, we were able to analyze the performance of each native ad in the Netflix campaign. Without direct access, there were some limitations to what we could examine, but we still came to some insightful conclusions.
The key findings were:
- Wired got more overall shares
- The New York Times won out when StumbleUpon shares were excluded
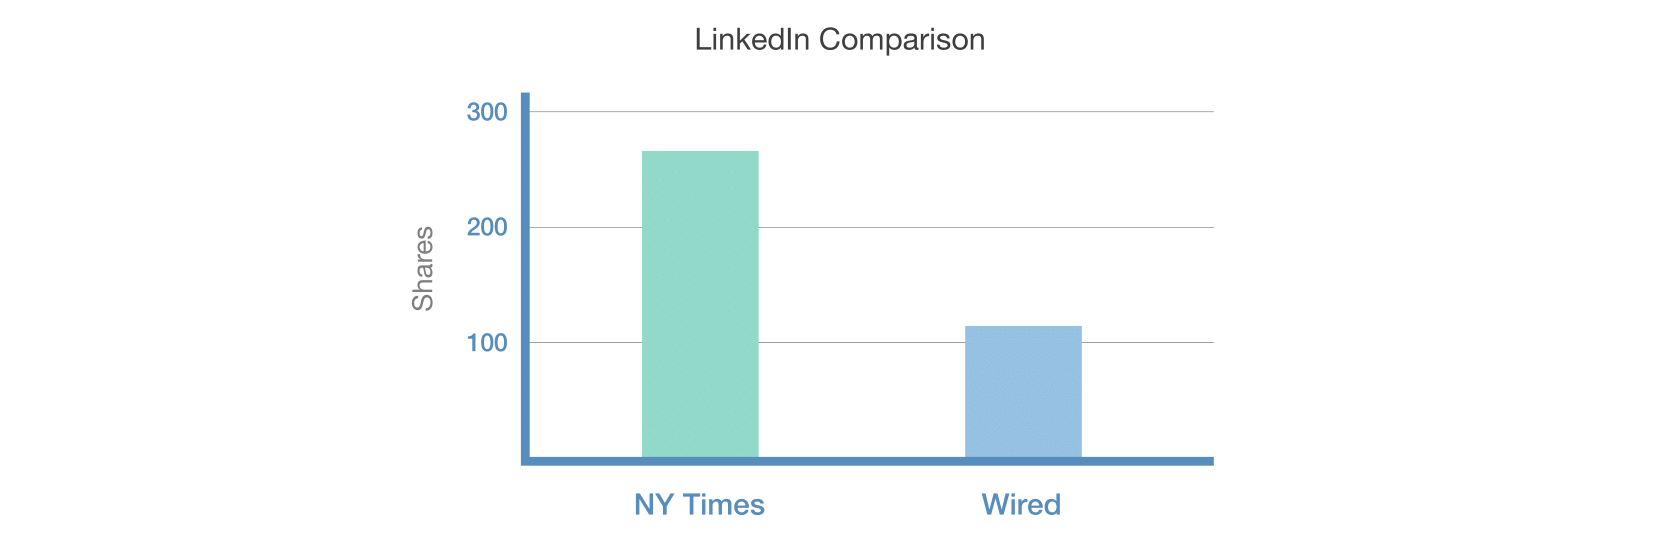
- The New York Times got more industry chatter
- The New York Times content garnered more attention minutes than Wired
- Both pieces of content played to their platforms’ strengths and community
Please read on for the full report.
Introduction
Objective
To understand how native ad content performs in major venues via a case study of Netflix’s investment in Wired and the New York Times.
Methodology
Typically when working with a brand, Nudge would be installed on each piece of content, which allows us to gather a rich set of metrics in real time. Using Nudge, we can collect information on engagement, virality, attention minutes, earned impressions, mobile vs. desktop performance, and more.
In this case study, we used our Nudge Diagnostic Tool, which analyzes content performance using public data and our own big data. This can measure shares by social network and create an estimation of earned impressions.
To broaden our data set, we also conducted a real-world test in which we redirected a sample of paid ads on Twitter through our system to the content. This allowed us to serve the content in an environment we controlled so we could directly measure the attention of each piece of content captured.
The limitations of this analysis are that we can’t measure:
- Total eyeballs on the site
- Content performance on mobile
- Engagement
- The effect of any paid distribution
However, we were able to compare the performance of the content based on shares, earned impressions and attention.
The Content
Netflix bought two pieces of content, the key component of any native ad campaign. One appeared on Wired’s website, the other on the New York Times website.
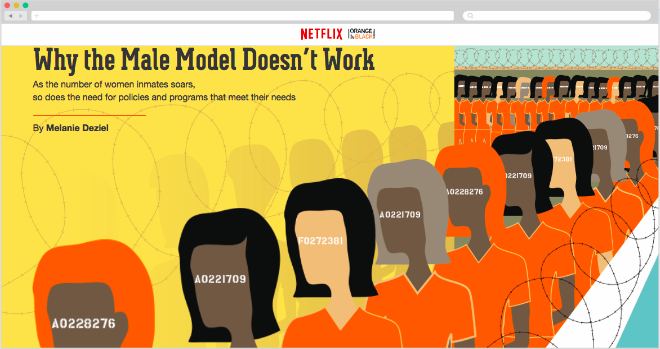
This article focused on female incarceration and its implications. The native ad has a direct link to the campaign’s objective: to create conversations around the popular Netflix show Orange is the New Black. It is clearly identified as a paid post and also well optimized for mobile.
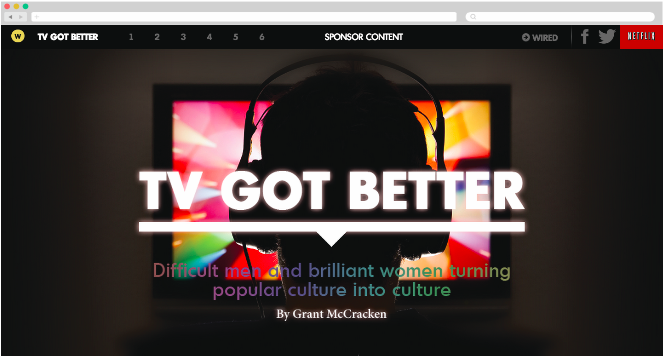
This article explored changing content consumption patterns and included a video from Arrested Development creator Mitch Hurwitz. Delivered in a parallax style of storytelling and authored by Grant McCracken, this is a great piece of content. It is clearly identified as sponsored content and optimized for mobile.
Topline Results
Discussion
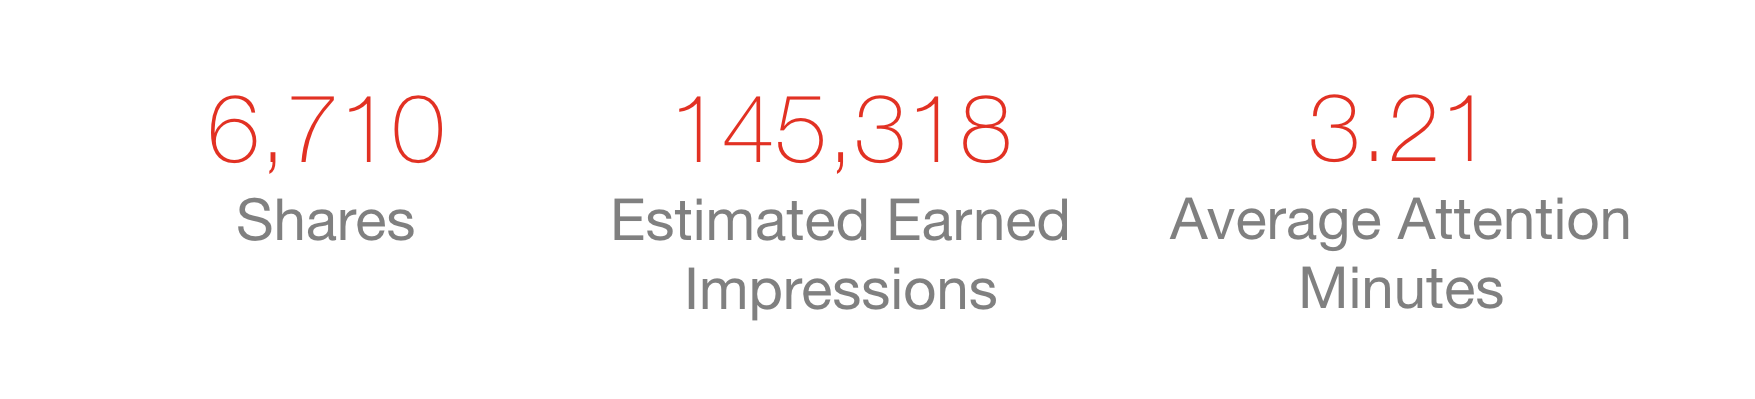
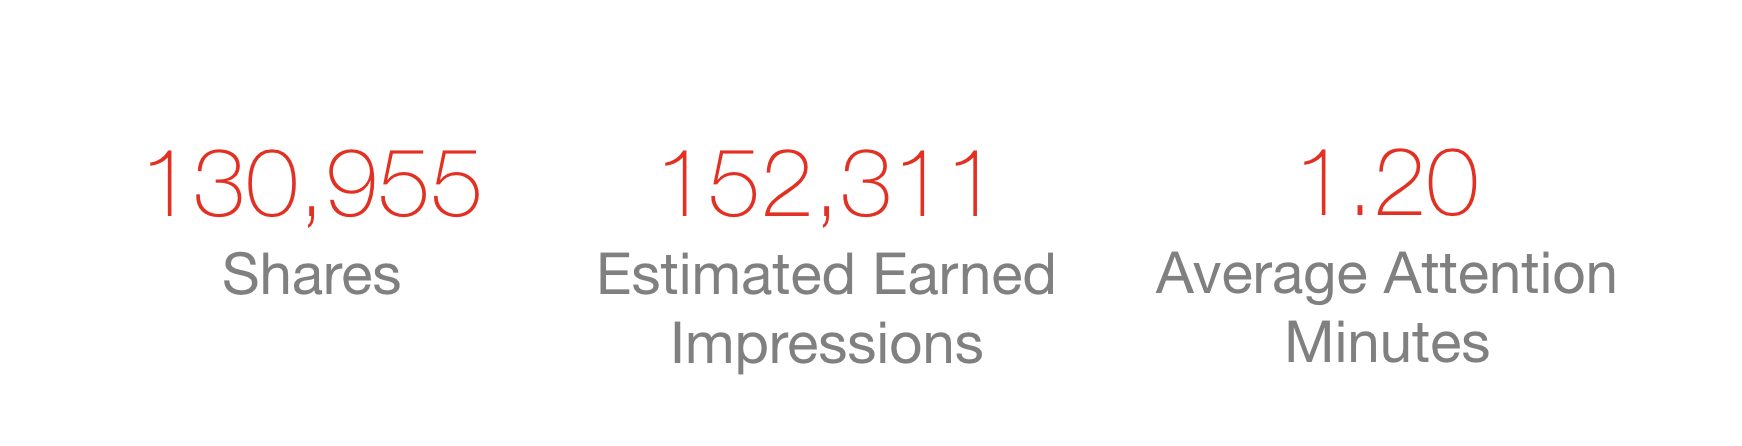
Overall, Wired had substantially more shares than the New York Times. However, 99.4% of those shares were from StumbleUpon, reflecting the nature of the Wired audience.
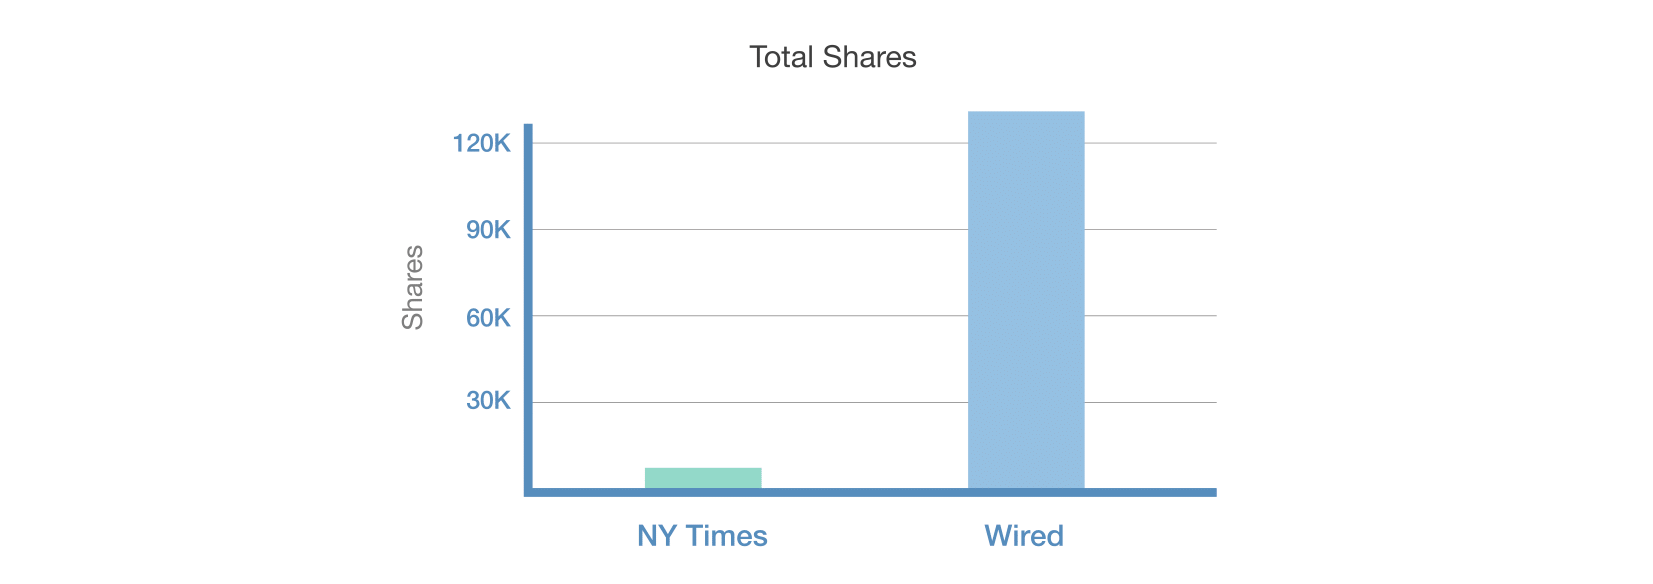
StumbleUpon is the fourth largest social network in terms of social referrals and sharing is how it works, so while there are significantly more shares from StumbleUpon, they generate fewer earned impressions per share.
When we remove StumbleUpon from the equation, the New York Times had more shares—meaning they had a broader consumer response to the content. This is likely due to the longer, more article-like content and its single focus, but it could also potentially be due to a higher traffic base.
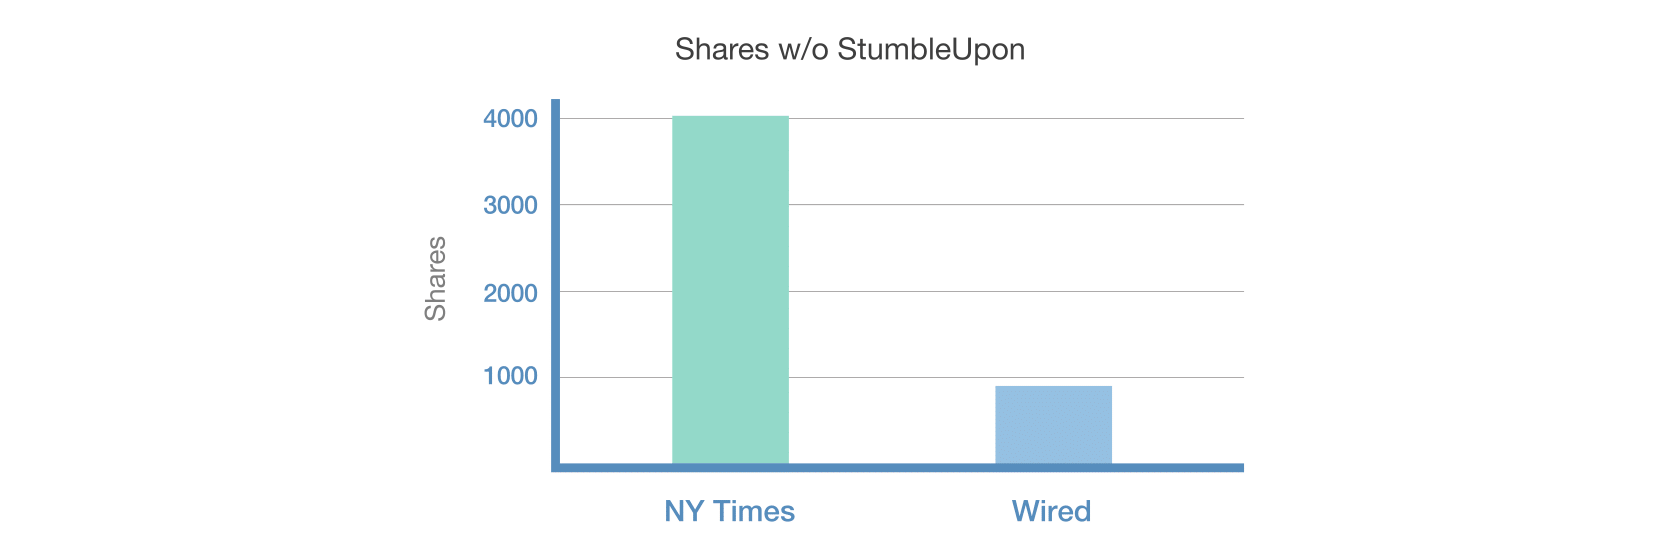
While diverse in media types, the Netflix content on Wired wasn’t one consistent stream, making it harder to share socially and more of a challenge to digest: what’s the one single-minded proposition being shared? This is a good reminder to keep campaigns focused on a single message. We see this right across the board: as an end user why would you share this content?
Industry Response
The New York Times had 2.5 times as many shares on LinkedIn. This was likely skewed by the industry response to the article and by industry insiders engaging in a conversation about the native ad itself since this was one of the first and most significant native ad placements in the Times.
Beyond Sharing: Attention Minutes
Sharing is a great quality measure for content: people share when they feel the content will add value and give them status. However, not all good content is shared. We need an additional metric to compare against: attention minutes.
There’s a strong argument for attention as a valuable metric. If people aren’t voting by sharing, they are voting with their eyeballs. This is a measure we’re unable to fully measure without direct access (our product Nudge does that when installed with a brand’s content), but we can still test attention minutes in other ways. In our test, we set people up to view the content via a paid ad. This redirected through a frame that let us measure what was going on. The key thing we were watching for is attention minutes.
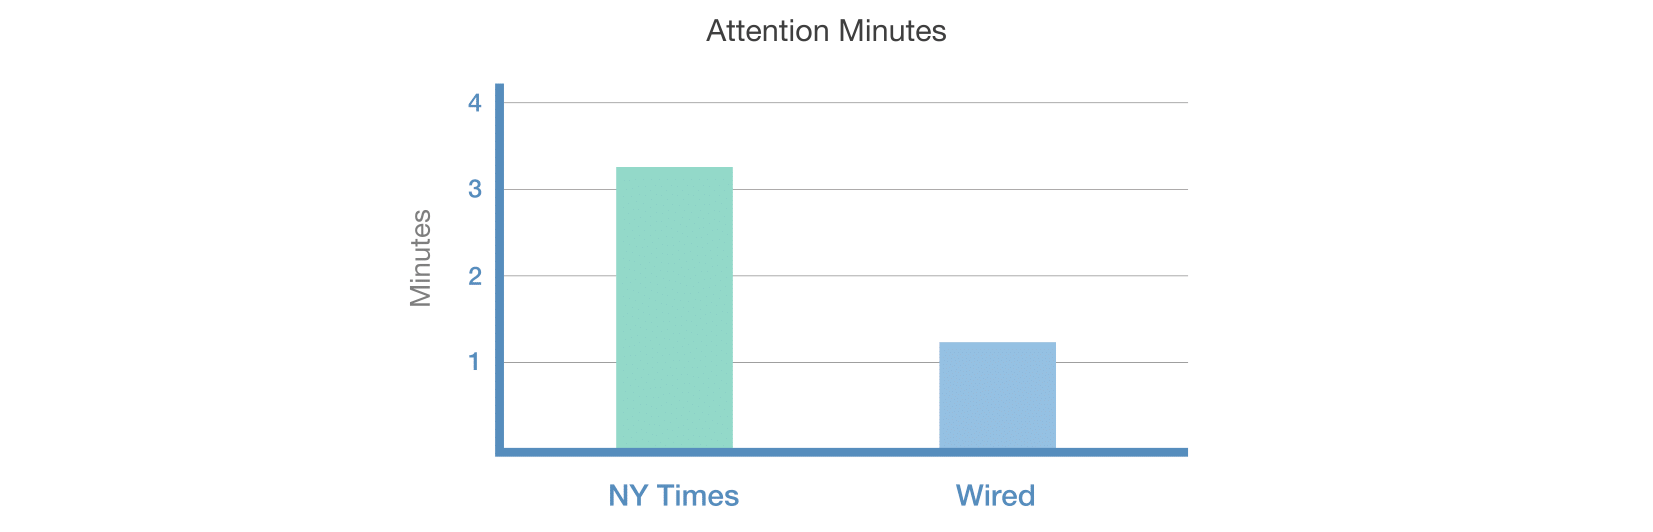
What we found in our limited test was that the New York Times content garnered more attention minutes per session. This lines up with the content length but is also a validation of the value of good creative content.
Earned Impressions
Earned impressions are an important quality metric, allowing you to see the impact of good creative content and compare how it performs across platforms and channels.
When we view the Netflix campaigns through this lens, Wired wins:
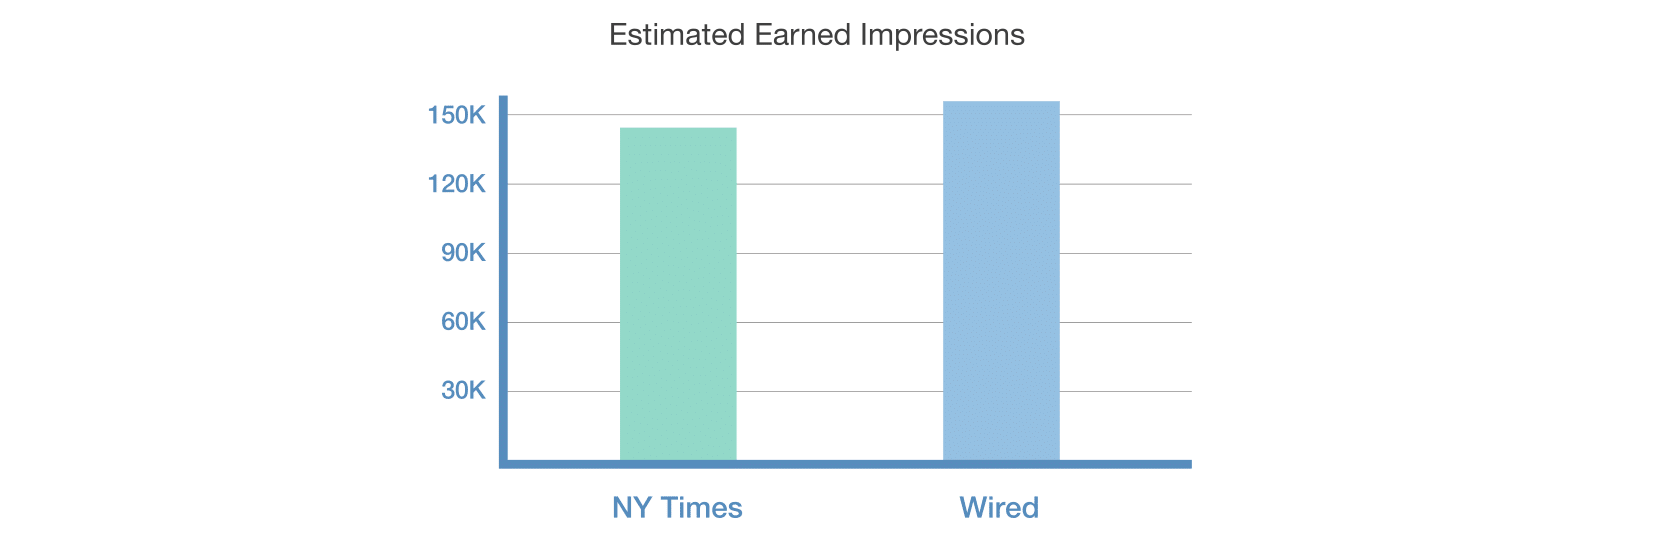
So while each piece of content tapped into difference audiences, in the end, the important earned impressions metric delivered similar results for both campaigns.
Engagement
Although we cannot measure engagement directly, we can make some predictions and estimations. Given the larger audience size of the New York Times (Quantcast data suggests 16.9 million/month as compared to 1.5 million/month for Wired), we would expect more traffic there, meaning that with the same volume of shares, we would anticipate a lower rate of engagement when compared to Wired. However without first-party data we are only able to speculate. If this was indeed the case, a strong argument could be made for Wired delivering a greater return on investment.
Conclusion
The two pieces of content Netflix used for its native ads were great executions, both highly polished and with different objectives. From our analysis we found:
- Wired got more overall shares
- The New York Times won out when StumbleUpon shares were excluded
- The New York Times got more industry chatter
- The New York Times content garnered more attention minutes than Wired
- Both pieces of content played to their platforms’ strengths and community
Understanding the engagement value of the content and its overall return on investment ultimately dictates how each performed. The challenge for Netflix is that it won’t get consistent benchmarks from the publishers because each will measure its campaign differently and issue a different report.
We also know that you can buy views, so measuring content performance by the number of impressions or uniques doesn’t really answer the question of which campaign performed better.
That’s where Nudge steps in. Rather than comparing apples with oranges, our consistent measurement gives your brand an apples-to-apples comparison. For publishers, this is also a useful tool, because it offers a standard benchmark for performance. Without knowing how content is evaluated, how can you argue that your competitors’ measures are better or worse than your own?
In the case of the Netflix content, it’s hard to draw solid conclusions without knowing the level of investment in each campaign. However, the New York Times delivered more attention minutes and similar amounts of earned impressions, performing best in these analyses.
Insights for Brands
Native ads are a rapidly growing space, with a number of complex considerations to keep in mind. There are a few components to a native ad campaign. Here, we explore the performance of the core: the actual content. Here are a few things to think about on your next campaign.
Use consistent analytics
When executing a native ad campaign, brands should use consistent analytics across all platforms and channels so that they have a solid ability to compare performance on an equal playing field.
Trust your content partner
Each piece of content should have a clear objective. Brands need to trust their media partners to craft content and guide them towards the best approach for their audience.
Don’t settle for one metric
For this investment, you need to collect a variety of quality metrics to understand the native ad’s performance. From engagement to virality to attention minutes, you need to collect all the data you can: these are all new but solid ways to compare performance across networks.
Extend beyond the native ad
Ensure you are using your native ads as part of a wider campaign. Cross-link content but also use retargeting cookies and conversion tracking so that you can build sustainable media assets while tracking ROI beyond the content.
To keep up to date with the latest developments in the native ad space make sure you sign up for our weekly Native Ad Insights newsletter over at the Nudge blog: http://giveitanudge.com/blog/.
|
|---|